Exam 5: Markets in Action
Exam 1: Economic Issues and Concepts107 Questions
Exam 2: Economic Theories, Data, and Graphs114 Questions
Exam 3: Demand, Supply, and Price134 Questions
Exam 4: Elasticity124 Questions
Exam 5: Markets in Action114 Questions
Exam 6: Consumer Behaviour119 Questions
Exam 7: Producers in the Short Run120 Questions
Exam 8: Producers in the Long Run110 Questions
Exam 9: Competitive Markets125 Questions
Exam 10: Monopoly, Cartels, and Price Discrimination110 Questions
Exam 11: Imperfect Competition110 Questions
Exam 12: Economic Efficiency and Public Policy109 Questions
Exam 13: How Factor Markets Work123 Questions
Exam 14: Labour Markets92 Questions
Exam 15: Interest Rates and the Capital Market90 Questions
Exam 16: Market Failures and Government Intervention110 Questions
Exam 17: The Economics of Environmental Protection110 Questions
Exam 18: Taxation and Public Expenditure110 Questions
Exam 33: The Gains From International Trade112 Questions
Exam 34: Trade Policy114 Questions
Select questions type
If the government imposes a price ceiling for some product, and a black market subsequently develops that gains control of all of the reduced output of the product, then
(Multiple Choice)
4.9/5  (39)
(39)
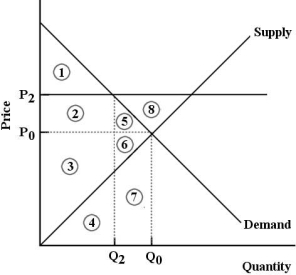 FIGURE 5- 7
-Refer to Figure 5- 7. The market for good X is in equilibrium at P0 and Q0. Now suppose the government imposes a at P2. One result would be .
FIGURE 5- 7
-Refer to Figure 5- 7. The market for good X is in equilibrium at P0 and Q0. Now suppose the government imposes a at P2. One result would be .
(Multiple Choice)
4.9/5 (44)
-Refer to Table 5- 1. Suppose the government imposed a price of $0.60 per chocolate bar. The result would be
(Multiple Choice)
4.8/5 (30)
The long- run elasticity of supply of rental housing is greater than the short- run elasticity of supply because
(Multiple Choice)
4.8/5 (31)
In the short run, the supply of rental accommodations tends to be
(Multiple Choice)
4.8/5 (31)
The short- run supply for housing is quite while the long- run supply for housing is quite
.
(Multiple Choice)
5.0/5 (37)
Consider a market that is in equilibrium with a market- clearing price. Economic surplus is shown by
(Multiple Choice)
4.8/5 (39)
In free and competitive markets, surpluses are eliminated by
(Multiple Choice)
4.8/5 (41)
Each point on a supply curve shows the _ _ acceptable price to firms for selling that unit; this price reflects to firms from producing that unit.
(Multiple Choice)
4.9/5 (38)
Consider the following demand and supply schedules for some agricultural commodity. Price Quantity Supplied Quantity Demanded \ 10 300 1100 \ 30 500 900 \ 50 700 700 \ 70 900 500 \ 90 1100 300 \ 110 1300 100 TABLE 5- 2
-Refer to Table 5- 2. Suppose we begin in a free- market equilibrium. If the government then imposes a production quota of 500 units, total farmers' income
(Multiple Choice)
4.8/5 (33)
In competitive markets, price floors and price ceilings usually lead to
(Multiple Choice)
4.8/5 (34)
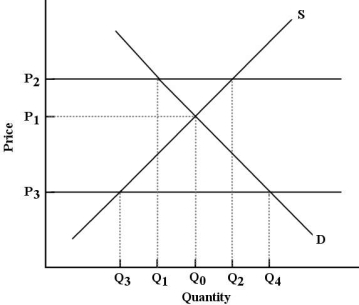 FIGURE 5- 3
-Refer to Figure 5- 3. If the government imposes a price floor at P3, the result would be a price and quantity combination of
FIGURE 5- 3
-Refer to Figure 5- 3. If the government imposes a price floor at P3, the result would be a price and quantity combination of
(Multiple Choice)
4.9/5 (40)
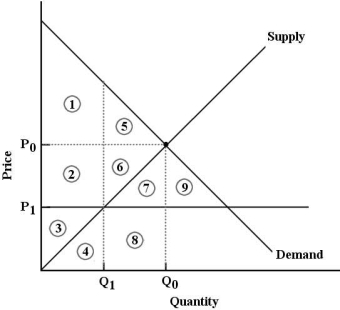 FIGURE 5- 6
-Refer to Figure 5- 6. The market for good X is in equilibrium at P0 and Q0. Economic surplus is represented by
FIGURE 5- 6
-Refer to Figure 5- 6. The market for good X is in equilibrium at P0 and Q0. Economic surplus is represented by
(Multiple Choice)
4.8/5 (35)
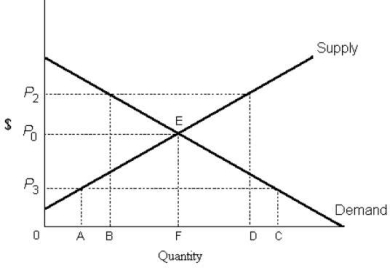 FIGURE 5- 1
-Refer to Figure 5- 1. To be binding, a legal price ceiling must lie
FIGURE 5- 1
-Refer to Figure 5- 1. To be binding, a legal price ceiling must lie
(Multiple Choice)
4.8/5 (42)
With respect to some commodity, X, if government objectives are to (1) restrict production and (2) keep prices down to protect consumers, then legislated price ceilings will
(Multiple Choice)
4.7/5 (40)
-Refer to Table 5- 1. Suppose that as a public- health measure the government wants to reduce the number of chocolate bars that children consume. To achieve this outcome the government could implement which of the following policies?
(Multiple Choice)
4.9/5 (43)
Each point on a demand curve shows the quantity. The demand curve therefore shows the product. 

(Multiple Choice)
4.8/5 (41)
Filters
- Essay(0)
- Multiple Choice(0)
- Short Answer(0)
- True False(0)
- Matching(0)