Exam 5: Markets in Action
Exam 1: Economic Issues and Concepts107 Questions
Exam 2: Economic Theories, Data, and Graphs114 Questions
Exam 3: Demand, Supply, and Price134 Questions
Exam 4: Elasticity124 Questions
Exam 5: Markets in Action114 Questions
Exam 6: Consumer Behaviour119 Questions
Exam 7: Producers in the Short Run120 Questions
Exam 8: Producers in the Long Run110 Questions
Exam 9: Competitive Markets125 Questions
Exam 10: Monopoly, Cartels, and Price Discrimination110 Questions
Exam 11: Imperfect Competition110 Questions
Exam 12: Economic Efficiency and Public Policy109 Questions
Exam 13: How Factor Markets Work123 Questions
Exam 14: Labour Markets92 Questions
Exam 15: Interest Rates and the Capital Market90 Questions
Exam 16: Market Failures and Government Intervention110 Questions
Exam 17: The Economics of Environmental Protection110 Questions
Exam 18: Taxation and Public Expenditure110 Questions
Exam 33: The Gains From International Trade112 Questions
Exam 34: Trade Policy114 Questions
Select questions type
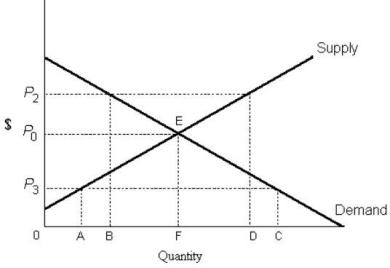 FIGURE 5- 1
-Refer to Figure 5- 1. If the diagram applies to the labour market, and P3 represents a legislated minimum wage,
FIGURE 5- 1
-Refer to Figure 5- 1. If the diagram applies to the labour market, and P3 represents a legislated minimum wage,
(Multiple Choice)
4.8/5  (35)
(35)
Which of the following statements best differentiates price ceilings and price floors?
(Multiple Choice)
4.9/5 (42)
-Refer to Table 5- 1. Suppose that as a public health measure the government wants to reduce the number of chocolate bars consumed by children. If the government imposes a price of $1.60 per chocolate bar, how many fewer chocolate bars will be consumed each week, relative to the competitive equilibrium?
(Multiple Choice)
4.9/5 (28)
The diagram below shows the market for apartments in a city. Assume that all apartments are identical. 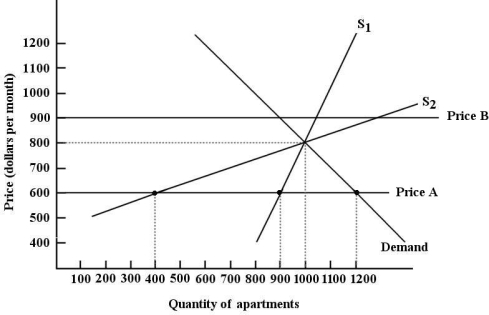 FIGURE 5- 4
-Refer to Figure 5- 4. The difference between supply curve S1 and supply curve S2 in this market for apartments is that
FIGURE 5- 4
-Refer to Figure 5- 4. The difference between supply curve S1 and supply curve S2 in this market for apartments is that
(Multiple Choice)
4.8/5 (29)
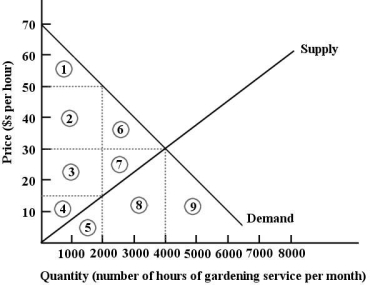 FIGURE 5- 5
-Refer to Figure 5- 5. At the market- clearing price and quantity of $30 per hour and 4000 hours of gardening services, we can say that
FIGURE 5- 5
-Refer to Figure 5- 5. At the market- clearing price and quantity of $30 per hour and 4000 hours of gardening services, we can say that
(Multiple Choice)
4.9/5 (41)
The price of a good or a service can be determined by free interaction of demand and supply or by a government price regulation. One important difference between these two price- determining methods is
(Multiple Choice)
4.8/5 (30)
If the equilibrium price for some product is $1000, a price ceiling of $1200 will result in
(Multiple Choice)
4.8/5 (38)
If 10 000 snow tires are produced and purchased in the month of November, we can say that economic surplus is
(Multiple Choice)
4.8/5 (34)
If an economist is conducting a partial- equilibrium analysis of the market for commuter jets, then he or she is
(Multiple Choice)
4.8/5 (37)
Filters
- Essay(0)
- Multiple Choice(0)
- Short Answer(0)
- True False(0)
- Matching(0)