Exam 14: Building Multiple Regression Models
Exam 1: Introduction to Statistics and Business Analytics180 Questions
Exam 2: Visualizing Data With Charts and Graphs113 Questions
Exam 3: Descriptive Statistics88 Questions
Exam 4: Probability104 Questions
Exam 5: Discrete Distributions98 Questions
Exam 6: Continuous Distributions105 Questions
Exam 7: Sampling and Sampling Distributions97 Questions
Exam 8: Statistical Inference: Estimation for Single Populations94 Questions
Exam 9: Statistical Inference: Hypothesis Testing for Single Populations123 Questions
Exam 10: Statistical Inferences About Two Populations97 Questions
Exam 11: Analysis of Variance and Design of Experiments133 Questions
Exam 12: Simple Regression Analysis and Correlation111 Questions
Exam 13: Multiple Regression Analysis90 Questions
Exam 14: Building Multiple Regression Models100 Questions
Exam 15: Time-Series Forecasting and Index Numbers103 Questions
Exam 16: Analysis of Categorical Data85 Questions
Exam 17: Nonparametric Statistics110 Questions
Exam 18: Statistical Quality Control99 Questions
Exam 19: Decision Analysis109 Questions
Select questions type
If a square-transformation is applied to a series of positive numbers, all greater than 1, the numerical values of the numbers in the transformed series will be smaller than the corresponding numbers in the original series.
(True/False)
5.0/5  (28)
(28)
The logistic regression model constrains the estimated probabilities to lie between 0 and 100.
(True/False)
4.9/5 (40)
A research project was conducted to study the effect of smoking and weight upon resting pulse rate.The response variable is coded as 1 when the pulse rate is low and 0 when it high.Smoking is also coding as 1 when smoking and 0 when not smoking.Shown below is the Minitab output from a logistic regression.
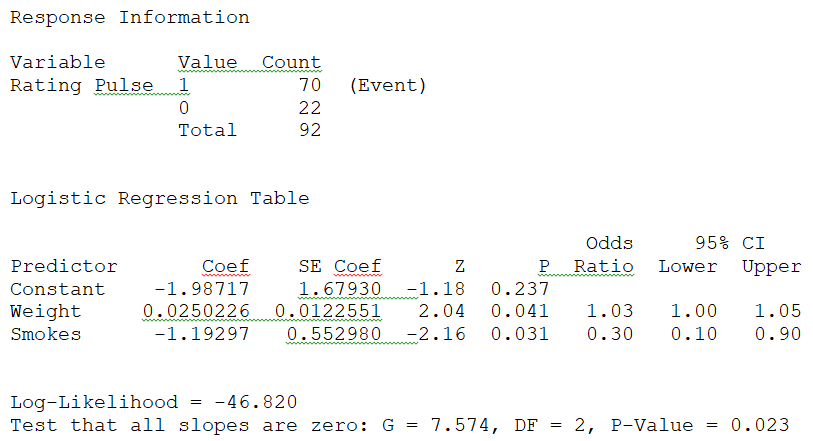 The predicted probability that a 150 pounds person who does not smoke has a high pulse rate is closest to _______.
(Multiple Choice)
5.0/5 (33)
Carlos Cavazos, Director of Human Resources, is exploring employee absenteeism at the Plano Piano Plant.A multiple regression analysis was performed using the following variables.The results are presented below. Variable Description Y number of days absent last fiscal year comrnuting distarnce (in miles) employee's age (in years) single-parent household (0= no, 1= yes ) length of employment at PpP (in years) shift (0= day 1= night) Coefficients Standard Error t Statistic p -value Intercept 6.594146 -0.18019 0.141949 -1.26939 0.208391 0.268156 0.260643 1.028828 0.307005 -2.31068 0.962056 -2.40182 0.018896 -0.50579 0.270872 -1.86725 0.065937 0.940321 2.47736 0.015584 SS ME F p -value Repression 5 279.358 55.8716 4.423755 Residual 67 846.2036 12.6299 Total 72 1125.562 R=0.498191 =0.248194 Adj =0.192089 =3.553858 n=73 Which of the following conclusions can be drawn from the above results?
(Multiple Choice)
4.7/5 (33)
A local parent group was concerned with the increasing cost of school for families with school aged children.The parent group was interested in understanding the relationship between the academic grade level for the child and the total costs spent per child per academic year.They performed a multiple regression analysis using total cost as the dependent variable and academic year (x1)as the independent variables.The multiple regression analysis produced the following tables. Coefficients Stardard Error t Statistic p -value Intercept 707.9144 435.1183 1.626947 0.114567 2.903307 81.62802 0.035568 0.971871 11.91297 3.806211 3.129878 0.003967 df Ss Ms F p -value Regression 2 32055153 16027577 47.34557 1.49-09 Residual 27 9140128 338523.3 Total 29 41195281 For a child in grade 5 (x1= 5), the predicted value of y is ____________.
(Multiple Choice)
4.8/5 (32)
Inspection of the following table of t values for variables in a multiple regression analysis reveals that the first independent variable that will be entered into the regression model by the forward selection procedure will be ___________. y y 1 0.854168 1 -0.11828 -0.00383 1 -0.12003 -0.08499 -0.14523 1 0.525901 0.118169 -0.14876 0.050042 1 -0.18105 -0.07371 0.995886 -0.14151 -0.16934 1
(Multiple Choice)
4.7/5 (35)
A useful technique in controlling multicollinearity involves the use of _________.
(Multiple Choice)
4.8/5 (37)
A logarithmic transformation may be applied to both positive and negative numbers.
(True/False)
4.8/5 (39)
An "all possible regressions" search of a data set containing 5 independent variables will produce ______ regressions.
(Multiple Choice)
4.9/5 (38)
A research project was conducted to study the effect of a chemical on undesired insects.The researcher uses 6 dose levels, and at each level exposes 250 insects to the chemical and proceeds to count the number of insects that die.The researcher uses a binary logistic regression model to estimate the probability of death as a function of dose. Shown below is Minitab output from a logistic regression.
Coefficients Term Coef SE Coef 95\% CI Z-Value P-Value VIF Constant -2.644 0.156 (-2.950,-2.338) -16.94 0.000 Dose 0.6740 0.0391 (0.5973,0.7506) 17.23 0.000 1.00
Odd Ratios for Continuous Predictors Odds Ratio 95\% Dose 1.9621(1.8173,2.1184)
The predicted probability that an insect will die when exposed to the first dose is ____.
(Multiple Choice)
4.8/5 (31)
Multiple linear regression models can handle certain nonlinear relationships by ________.
(Multiple Choice)
4.9/5 (38)
Alan Bissell, a market analyst for City Sound Online Mart, is analyzing sales from heavy metal song downloads.Alan's dependent variable is annual heavy metal song download sales (in $1,000,000's), and his independent variables are website visitors (in 1,000's)and type of download format requested (0 = MP3, 1 = other).Regression analysis of the data yielded the following tables. Coefficients Standard Error t Statistic p -value Iritercept 1.7 0.384212 4.424638 0.00166 (websitevisitors) 0.04 0.014029 2.851146 0.019054 (download format) -1.5666667 0.20518 -7.63558 3.21E-05 For the same number of website visitors, what is difference between the predicted sales for MP3 versus 'other' heavy metal song downloads
(Multiple Choice)
4.8/5 (32)
A local parent group was concerned with the increasing cost of school for families with school aged children.The parent group was interested in understanding the relationship between the academic grade level for the child and the total costs spent per child per academic year.They performed a multiple regression analysis using total cost as the dependent variable and academic year (x1)as the independent variables.The multiple regression analysis produced the following tables. Coefficients Stardard Error t Statistic p -value Intercept 707.9144 435.1183 1.626947 0.114567 2.903307 81.62802 0.035568 0.971871 11.91297 3.806211 3.129878 0.003967 F p -value Repression 2 32055153 16027577 47.34557 1.49-09 Residual 27 9140128 Total 41195281 The sample size for this analysis is ____________.
(Multiple Choice)
4.9/5 (45)
The regression model y = 0 + 1 x1 + 2 x2 + 3 x1x2 + is a first order model.
(True/False)
4.9/5 (25)
Abby Kratz, a market specialist at the market research firm of Saez, Sikes, and Spitz, is analyzing household budget data collected by her firm.Abby's dependent variable is weekly household expenditures on groceries (in $'s), and her independent variables are annual household income (in $1,000's)and household neighborhood (0 = suburban, 1 = rural).Regression analysis of the data yielded the following table. Coefficients Stardard Error t Statistic p -value Intercept 19.68247 10.01176 1.965934 0.077667 (income) 1.735272 0.174564 9.940612 1.68-06 (neighborhood) 49.12456 7.655776 6.416667 7.67-05 For a suburban household with $90,000 annual income, Abby's model predicts weekly grocery expenditure of ________________.
(Multiple Choice)
4.7/5 (34)
If the variance inflation factor is bigger than 10, the regression analysis might suffer from the problem of multicollinearity.
(True/False)
4.8/5 (41)
Abby Kratz, a market specialist at the market research firm of Saez, Sikes, and Spitz, is analyzing household budget data collected by her firm.Abby's dependent variable is weekly household expenditures on groceries (in $'s), and her independent variables are annual household income (in $1,000's)and household neighborhood (0 = suburban, 1 = rural).Regression analysis of the data yielded the following table. Coefficients Stardard Error t Statistic p -value Intercept 19.68247 10.01176 1.965934 0.077667 (income) 1.735272 0.174564 9.940612 1.68-06 (neighborhood) 49.12456 7.655776 6.416667 7.67-05 For a suburban household with ______ annual income, Abby's model predicts weekly grocery expenditure of $235.
(Multiple Choice)
4.9/5 (41)
If two or more independent variables are highly correlated, the regression analysis is unlikely to suffer from the problem of multicollinearity.
(True/False)
4.8/5 (28)
A multiple regression analysis produced the following tables. Coefficients Stardard Error t Statistic p -value Irtercept 1411.876 762.1533 1.852483 0.074919 35.18215 96.8433 0.363289 0.719218 7.721648 3.007943 2.567086 0.016115 F Repression 2 58567032 29283516 57.34861 Residual 25 12765573 5106229 Total 27 71332605 The regression equation for this analysis is ____________.
(Multiple Choice)
4.8/5 (43)
A multiple regression analysis produced the following tables. Coefficients Stardard Error t Statistic p -value Irtercept 1411.876 762.1533 1.852483 0.074919 35.18215 96.8433 0.363289 0.719218 7.721648 3.007943 2.567086 0.016115 F Repression 2 58567032 29283516 57.34861 Residual 25 12765573 5106229 Total 27 71332605 Using = 0.10 to test the null hypothesis H0: 1 = 0, the critical t value is ____.
(Multiple Choice)
4.9/5 (35)
Filters
- Essay(0)
- Multiple Choice(0)
- Short Answer(0)
- True False(0)
- Matching(0)