Exam 14: Building Multiple Regression Models
Exam 1: Introduction to Statistics and Business Analytics180 Questions
Exam 2: Visualizing Data With Charts and Graphs113 Questions
Exam 3: Descriptive Statistics88 Questions
Exam 4: Probability104 Questions
Exam 5: Discrete Distributions98 Questions
Exam 6: Continuous Distributions105 Questions
Exam 7: Sampling and Sampling Distributions97 Questions
Exam 8: Statistical Inference: Estimation for Single Populations94 Questions
Exam 9: Statistical Inference: Hypothesis Testing for Single Populations123 Questions
Exam 10: Statistical Inferences About Two Populations97 Questions
Exam 11: Analysis of Variance and Design of Experiments133 Questions
Exam 12: Simple Regression Analysis and Correlation111 Questions
Exam 13: Multiple Regression Analysis90 Questions
Exam 14: Building Multiple Regression Models100 Questions
Exam 15: Time-Series Forecasting and Index Numbers103 Questions
Exam 16: Analysis of Categorical Data85 Questions
Exam 17: Nonparametric Statistics110 Questions
Exam 18: Statistical Quality Control99 Questions
Exam 19: Decision Analysis109 Questions
Select questions type
Abby Kratz, a market specialist at the market research firm of Saez, Sikes, and Spitz, is analyzing household budget data collected by her firm.Abby's dependent variable is weekly household expenditures on groceries (in $'s), and her independent variables are annual household income (in $1,000's)and household neighborhood (0 = suburban, 1 = rural).Regression analysis of the data yielded the following table. Coefficients Stardard Error t Statistic p -value Intercept 19.68247 10.01176 1.965934 0.077667 (income) 1.735272 0.174564 9.940612 1.68-06 (neighborhood) 49.12456 7.655776 6.416667 7.67-05 However, Abby has reasons to believe that actually suburban households have a higher propensity to spend in groceries than rural households, as they tend to make more impulse purchasing decisions.In this new model, the actual income coefficient for the suburban families is 1.735272 , for some > 1.If new data confirms that suburban houses with an annual income of $95,773.44 have the same weekly grocery spending as rural households, then = ______.
(Multiple Choice)
4.8/5  (38)
(38)
Regression models in which the highest power of any predictor variable is 1 and in which there are no cross product terms are referred to as first-order models.
(True/False)
5.0/5 (25)
Which of the following iterative search procedures for model-building in a multiple regression analysis reevaluates the contribution of variables previously include in the model after entering a new independent variable?
(Multiple Choice)
4.9/5 (30)
A research project was conducted to study the effect of smoking and weight upon resting pulse rate.The response variable is coded as 1 when the pulse rate is low and 0 when it high.Smoking is also coding as 1 when smoking and 0 when not smoking.Shown below is the Minitab output from a logistic regression.
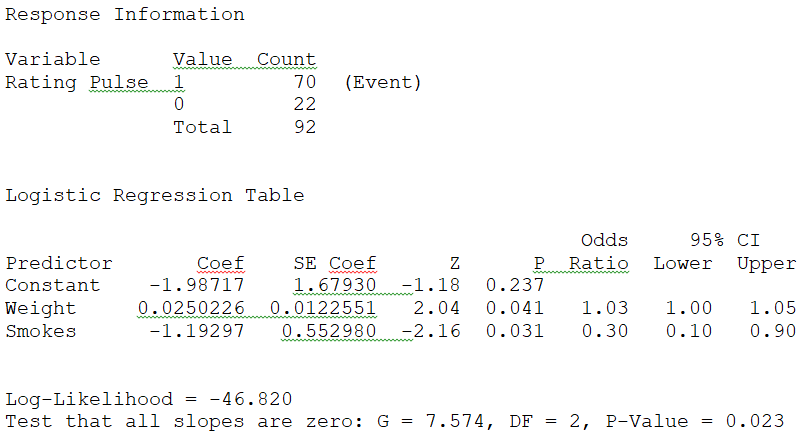 The log of the odds ratio or logit equation is:
(Multiple Choice)
4.9/5 (35)
In multiple regression analysis, qualitative variables are sometimes referred to as ___.
(Multiple Choice)
4.9/5 (38)
If a data set contains k independent variables, the "all possible regression" search procedure will determine 2k - 1 different models.
(True/False)
4.8/5 (27)
A local parent group was concerned with the increasing cost of school for families with school aged children.The parent group was interested in understanding the relationship between the academic grade level for the child and the total costs spent per child per academic year.They performed a multiple regression analysis using total cost as the dependent variable and academic year (x1)as the independent variables.The multiple regression analysis produced the following tables. Coefficients Stardard Error t Statistic p -value Intercept 707.9144 435.1183 1.626947 0.114567 2.903307 81.62802 0.035568 0.971871 11.91297 3.806211 3.129878 0.003967 df SS MS F p -value Regression 2 32055153 16027577 47.34557 1.49-09 Residual 27 9140128 338523.3 Total 29 41195281 Using = 0.05 to test the null hypothesis H0: 1 = 0, the critical t value is ____.
(Multiple Choice)
4.9/5 (31)
Hope Hernandez is the new regional Vice President for a large gasoline station chain.She wants a regression model to predict sales in the convenience stores.Her data set includes two qualitative variables: the gasoline station location (inner city, freeway, and suburbs), and curb appeal of the convenience store (low, medium, and high).The number of dummy variables needed for Hope's regression model is ______.
(Multiple Choice)
4.7/5 (32)
The regression model y = 0 + 1 x1 + 2 x2 + 3 x3 + is a third order model.
(True/False)
4.9/5 (28)
A multiple regression analysis produced the following tables. Coefficients Stardard Error t Statistic p -value Irtercept 1411.876 762.1533 1.852483 0.074919 35.18215 96.8433 0.363289 0.719218 7.721648 2.567086 0.016115 F Regression 2 58567032 29283516 57.34861 Residual 25 12765573 510622.9 Total 27 71332605 For x1= 20, the predicted value of y is ____________.
(Multiple Choice)
4.8/5 (33)
A multiple regression analysis produced the following tables. Coefficients Stardard Error t Statistic p -value Irtercept 1411.876 762.1533 1.852483 0.074919 35.18215 96.8433 0.363289 0.719218 7.721648 3.007943 2.567086 0.016115 F Repression 2 58567032 29283516 57.34861 Residual 25 12765573 5106229 Total 27 71332605 Using = 0.10 to test the null hypothesis H0: 2 = 0, the critical t value is ____.
(Multiple Choice)
4.9/5 (32)
An appropriate method to identify multicollinearity in a regression model is to ____.
(Multiple Choice)
4.9/5 (32)
A local parent group was concerned with the increasing cost of school for families with school aged children.The parent group was interested in understanding the relationship between the academic grade level for the child and the total costs spent per child per academic year.They performed a multiple regression analysis using total cost as the dependent variable and academic year (x1)as the independent variables.The multiple regression analysis produced the following tables. Coefficients Stardard Error t Statistic p -value Intercept 707.9144 435.1183 1.626947 0.114567 2.903307 81.62802 0.035568 0.971871 11.91297 3.806211 3.129878 0.003967 df Ss Ms F p -value Regression 2 32055153 16027577 47.34557 1.49-09 Residual 27 9140128 338523.3 Total 29 41195281 For a child in grade 10 (x1= 10)the predicted value of y is ____________.
(Multiple Choice)
4.8/5 (30)
Which of the following problems is not caused by multicollinearity?
(Multiple Choice)
4.8/5 (39)
A local parent group was concerned with the increasing cost of school for families with school aged children.The parent group was interested in understanding the relationship between the academic grade level for the child and the total costs spent per child per academic year.They performed a multiple regression analysis using total cost as the dependent variable and academic year (x1)as the independent variables.The multiple regression analysis produced the following tables. Coefficients Stardard Error t Statistic p -value Intercept 707.9144 435.1183 1.626947 0.114567 2.903307 81.62802 0.035568 0.971871 11.91297 3.806211 3.129878 0.003967 Df SS MS F p -value Regression 2 32055153 16027577 47.34557 1.49-09 Residual 27 9140128 338523.3 Total 29 41195281 The regression equation for this analysis is ____________.
(Multiple Choice)
4.8/5 (36)
Abby Kratz, a market specialist at the market research firm of Saez, Sikes, and Spitz, is analyzing household budget data collected by her firm.Abby's dependent variable is weekly household expenditures on groceries (in $'s), and her independent variables are annual household income (in $1,000's)and household neighborhood (0 = suburban, 1 = rural).Regression analysis of the data yielded the following table. Coefficients Stardard Error t Statistic p -value Irtercept 19.68247 10.01176 1.965934 0.077667 (incorne) 1.735272 0.174564 9.940612 1.68-06 (neighborhood) 49.12456 7.655776 6.416667 7.67-05 For two households, one suburban and one rural, Abby's model predicts ________.
(Multiple Choice)
4.8/5 (31)
A multiple regression analysis produced the following tables. Coefficients Stardard Error t Statistic p -value Irtercept 1411.876 7.621533 35.18215 96.8433 -7.721648 F Regression 2 58567032 29283516 57.34861 Residual 25 12765573 510622.9 Total 27 71332605 The minimum value of the predicted value of the dependent variable is reached when
X1 = ______.
(Multiple Choice)
4.9/5 (35)
Inspection of the following table of correlation coefficients for variables in a multiple regression analysis reveals potential multicollinearity with variables ___________. y y 1 0.854168 1 -0.11828 -0.00383 1 -0.12003 -0.08499 -0.14523 1 0.525901 0.118169 -0.14876 0.050042 1 -0.18105 -0.07371 0.995886 -0.14151 -0.16934 1
(Multiple Choice)
4.9/5 (32)
An "all possible regressions" search of a data set containing 7 independent variables will produce ______ regressions.
(Multiple Choice)
4.8/5 (47)
Filters
- Essay(0)
- Multiple Choice(0)
- Short Answer(0)
- True False(0)
- Matching(0)