Exam 13: Multiple Regression Analysis
Exam 1: Introduction to Statistics and Business Analytics180 Questions
Exam 2: Visualizing Data With Charts and Graphs113 Questions
Exam 3: Descriptive Statistics88 Questions
Exam 4: Probability104 Questions
Exam 5: Discrete Distributions98 Questions
Exam 6: Continuous Distributions105 Questions
Exam 7: Sampling and Sampling Distributions97 Questions
Exam 8: Statistical Inference: Estimation for Single Populations94 Questions
Exam 9: Statistical Inference: Hypothesis Testing for Single Populations123 Questions
Exam 10: Statistical Inferences About Two Populations97 Questions
Exam 11: Analysis of Variance and Design of Experiments133 Questions
Exam 12: Simple Regression Analysis and Correlation111 Questions
Exam 13: Multiple Regression Analysis90 Questions
Exam 14: Building Multiple Regression Models100 Questions
Exam 15: Time-Series Forecasting and Index Numbers103 Questions
Exam 16: Analysis of Categorical Data85 Questions
Exam 17: Nonparametric Statistics110 Questions
Exam 18: Statistical Quality Control99 Questions
Exam 19: Decision Analysis109 Questions
Select questions type
A multiple regression analysis produced the following tables. Predictor Coefficients Stardard Error Statistic p -value Irtercept -139.609 2548.989 -0.05477 0.957154 24.24619 22.25267 1.089586 32.10171 17.44559 1.840105 0.08869 Source SS MS F p -value Repression 2 302689 151344.5 1.705942 0.219838 Residual 13 1153309 88716.07 Total 15 1455998 The coefficient of multiple determination is ____________.
Free
(Multiple Choice)
4.8/5  (31)
(31)
Correct Answer: Verified
A
A multiple regression analysis produced the following tables. Predictor Coefficierts Stardard Error -value Irntercept 752.0833 11.87375 5.32047 1.908183 Source SS MS F p -value Regression 2 203693.3 101846.7 6.745406 0.010884 Residual 12 181184.1 15098.67 Total 14 384877.4 Using = 0.10 to test the null hypothesis H0: 1 = 2 = 0, the critical F value is ______.
Free
(Multiple Choice)
4.8/5 (36)
Correct Answer:Verified
B
The F value that is used to test for the overall significance of a multiple regression model is calculated by dividing the mean square regression (MSreg)by the mean square error (MSerr).
Free
(True/False)
4.8/5 (35)
Correct Answer:Verified
True
A multiple regression analysis produced the following tables.  Using = 0.01 to test the model, these results indicate that ____________.
(Multiple Choice)
4.9/5 (33)
The F value that is used to test for the overall significance of a multiple regression model is calculated by dividing the sum of mean squares regression (SSreg)by the sum of squares error (SSerr).
(True/False)
4.8/5 (31)
A multiple regression analysis produced the following tables. Predictor Coefficients Stardard Error t Statistic p -value Irtercept 624.5369 78.49712 7.956176 6.88E-06 8.569122 1.652255 5.186319 4.736515 0.699194 6.774248 Source SS MS F p -value Repression 2 1660914 58.31956 1.4-06 Residual 11 156637.5 14239.77 Total 13 1817552 For x1= 30 and x2 = 100, the predicted value of y is ____________.
(Multiple Choice)
4.7/5 (33)
If we reject H0: β1= β2=0 using the F-test, then we should conclude that both slopes are different from zero.
(True/False)
4.8/5 (34)
A multiple regression analysis produced the following output from Minitab. Regression Analysis: Y versus x1 and x2
Predictor Coef SE Coef T P
Constant -0.0626 0.2034 -0.31 0.762
X1 1.1003 0.5441 2.02 0.058
X2 -0.8960 0.5548 -1.61 0.124
S = 0.179449 R-Sq = 89.0% R-Sq(adj)= 87.8%
Analysis of Variance
Source DF SS MS F P
Regression 2 4.7013 2.3506 73.00 0.000
Residual Error 18 0.5796 0.0322
Total 20 5.2809
The overall proportion of variation of y accounted by x1 and x2 is _______
(Multiple Choice)
4.7/5 (44)
A multiple regression analysis produced the following output from Excel. 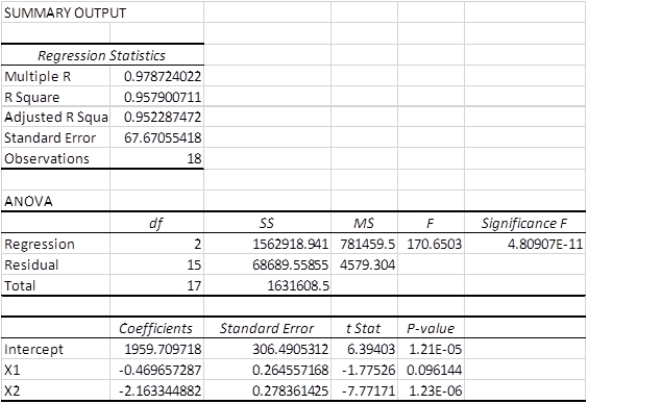 The coefficient of multiple determination is ____________.
(Multiple Choice)
4.9/5 (31)
A multiple regression analysis produced the following tables. Predictor Coefficients Stardard Eror Statistic p -value Irtercept 616.6849 154.5534 3.990108 0.000947 -3.33833 -1.43058 1.780075 5.30407 5.83-05 Source SS MS F p -value Repression 2 121783 60891.48 14.76117 0.000286 Residual 15 61876.68 4125.112 Total 17 183659.6 The sample size for this analysis is ____________.
(Multiple Choice)
4.8/5 (35)
A multiple regression analysis produced the following tables. Predictor Coefficients Stardard Error Statistic p -value Irtercept -139.609 2548.989 -0.05477 0.957154 24.24619 22.25267 1.089586 32.10171 17.44559 1.840105 0.08869 Source SS MS F p -value Repression 2 302689 151344.5 1.705942 0.219838 Residual 13 1153309 88716.07 Total 15 1455998 The adjusted R2 is ____________.
(Multiple Choice)
4.8/5 (32)
In regression analysis, outliers may be identified by examining the ________.
(Multiple Choice)
5.0/5 (43)
The following ANOVA table is from a multiple regression analysis. Source F p Repression 3 1500 Error 26 Total 2300 The SSE value is __________.
(Multiple Choice)
5.0/5 (37)
A multiple regression analysis produced the following tables. 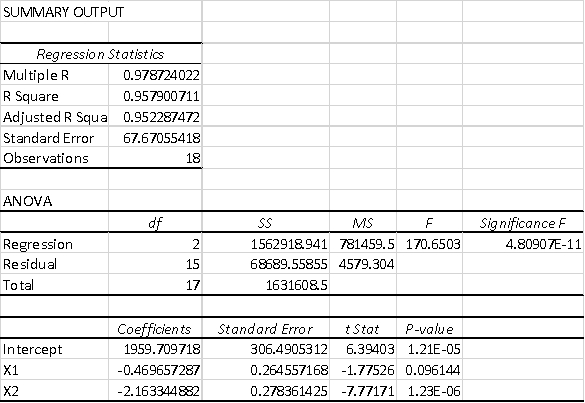 For x1= 360 and x2 = 220, the predicted value of y is ____________.
(Multiple Choice)
4.7/5 (36)
In a multiple regression model, the proportion of the variation of the dependent variable, y, accounted for the independent variables in the regression model is given by the coefficient of multiple correlation.
(True/False)
4.9/5 (37)
A multiple regression analysis produced the following tables. Predictor Coefficierts Stardard Error -value Irntercept 752.0833 11.87375 5.32047 1.908183 Source SS MS F p -value Regression 2 203693.3 101846.7 6.745406 0.010884 Residual 12 181184.1 15098.67 Total 14 384877.4 These results indicate that ____________.
(Multiple Choice)
4.9/5 (32)
The following ANOVA table is from a multiple regression analysis. Source F p Repression 3 1500 Error 26 Total 2300 The value of the standard error of the estimate se is __________.
(Multiple Choice)
4.9/5 (35)
A multiple regression analysis produced the following tables. Predictor Coefficients Stardard Eror Statistic p -value Irtercept 616.6849 154.5534 3.990108 0.000947 -3.33833 -1.43058 1.780075 5.30407 5.83-05 Source SS MS F p -value Repression 2 121783 60891.48 14.76117 0.000286 Residual 15 61876.68 4125.112 Total 17 183659.6 Using = 0.05 to test the null hypothesis H0: 1 = 0, the critical t value is ____.
(Multiple Choice)
4.8/5 (29)
Minitab and Excel output for a multiple regression model show the t tests for the regression coefficients but do not provide a t test for the regression constant.
(True/False)
4.8/5 (33)
The following ANOVA table is from a multiple regression analysis with n = 35 and four independent variables. Source F p Repression 700 Error Total 1000 The R2 value is __________.
(Multiple Choice)
4.9/5 (35)
Filters
- Essay(0)
- Multiple Choice(0)
- Short Answer(0)
- True False(0)
- Matching(0)