Exam 12: Simple Regression Analysis and Correlation
Exam 1: Introduction to Statistics and Business Analytics180 Questions
Exam 2: Visualizing Data With Charts and Graphs113 Questions
Exam 3: Descriptive Statistics88 Questions
Exam 4: Probability104 Questions
Exam 5: Discrete Distributions98 Questions
Exam 6: Continuous Distributions105 Questions
Exam 7: Sampling and Sampling Distributions97 Questions
Exam 8: Statistical Inference: Estimation for Single Populations94 Questions
Exam 9: Statistical Inference: Hypothesis Testing for Single Populations123 Questions
Exam 10: Statistical Inferences About Two Populations97 Questions
Exam 11: Analysis of Variance and Design of Experiments133 Questions
Exam 12: Simple Regression Analysis and Correlation111 Questions
Exam 13: Multiple Regression Analysis90 Questions
Exam 14: Building Multiple Regression Models100 Questions
Exam 15: Time-Series Forecasting and Index Numbers103 Questions
Exam 16: Analysis of Categorical Data85 Questions
Exam 17: Nonparametric Statistics110 Questions
Exam 18: Statistical Quality Control99 Questions
Exam 19: Decision Analysis109 Questions
Select questions type
In a regression analysis if SST = 200 and SSR = 200, r 2 = _________.
(Multiple Choice)
4.8/5  (38)
(38)
Given x, a 95% prediction interval for a single value of y is always wider than a 95% confidence interval for the average value of y.
(True/False)
4.8/5 (25)
Annie Mikhail, market analyst for a national company specializing in historic city tours, is analyzing the relationship between the sales revenue from historic city tours and the size of the city.She gathers data from six cities in which the tours are offered.Annie's dependent variable is annual sales revenues and her independent variable is the city population.Regression analysis of the data yielded the following tables. 
 The numerical value of the correlation coefficient between the historic city tour sales and the size of city population is __________.
(Multiple Choice)
4.8/5 (37)
A cost accountant is developing a regression model to predict the total cost of producing a batch of printed circuit boards as a linear function of batch size (the number of boards produced in one lot or batch).The intercept of this model is the ______.
(Multiple Choice)
4.8/5 (37)
The range of admissible values for the coefficient of determination is −1 to +1.
(True/False)
5.0/5 (38)
In regression analysis, the variable that is being predicted is usually referred to as the independent variable.
(True/False)
4.7/5 (29)
The coefficient of correlation in a simple regression analysis is = - 0.6.The coefficient of determination for this regression would be _______.
(Multiple Choice)
4.9/5 (35)
If x and y in a regression model are totally unrelated, _______.
(Multiple Choice)
4.9/5 (35)
The variability in the estimated slope is smaller when the x-values are more spread out.
(True/False)
4.7/5 (34)
From the following scatter plot, we can say that between y and x there is _______. 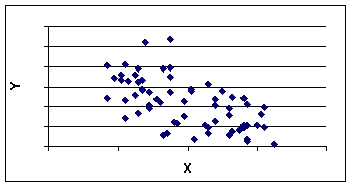
(Multiple Choice)
4.9/5 (38)
A researcher has developed the regression equation ŷ = 2.164 + 1.3657x, where n = 6, the mean of x is 8.667, Sxx = 89.333, and Se = 3.44.The researcher wants to test if the slope is significantly positive, and he chooses a significance level of 0.05.The observed t value is ______.
(Multiple Choice)
4.9/5 (29)
A prediction interval based on a specific value of x will reflect an estimate of the dependent variable for one person or thing from the population.
(True/False)
4.9/5 (30)
Abby Kratz, a market specialist at the market research firm of Saez, Sikes, and Spitz, is analyzing household budget data collected by her firm.Abby's dependent variable is monthly household expenditures on groceries (in $'s), and her independent variable is annual household income (in $1,000's).Regression analysis of the data yielded the following tables.  Source df SS F Regresssiom 1 76850.99 16850.99 19.34446 Retidual 9 7839.915 871.1017 Total 10 24690.91 =29.51448 =0.682478 The correlation coefficient between the two variables in this regression is __________.
(Multiple Choice)
4.8/5 (30)
From the following scatter plot, we can say that between y and x there is _______. 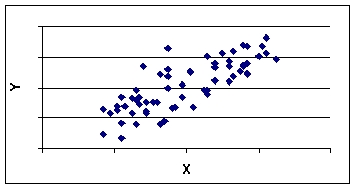
(Multiple Choice)
4.8/5 (32)
Annie Mikhail, market analyst for a national company specializing in historic city tours, is analyzing the relationship between the sales revenue from historic city tours and the size of the city.She gathers data from six cities in which the tours are offered.Annie's dependent variable is annual sales revenues and her independent variable is the city population.Regression analysis of the data yielded the following tables.  Souros df SS MS F Recrem 1 3.550325 3.550325 63.20809 Residval 4 0224675 0.056169 Total 5 3.775
=0.237 =0.940483 Using = 0.05, Annie should ________________.
Souros df SS MS F Recrem 1 3.550325 3.550325 63.20809 Residval 4 0224675 0.056169 Total 5 3.775
=0.237 =0.940483 Using = 0.05, Annie should ________________.
(Multiple Choice)
5.0/5 (44)
Louis Katz, a cost accountant at Papalote Plastics, Inc.(PPI), is analyzing the manufacturing costs of a molded plastic telephone handset produced by PPI.Louis's independent variable is production lot size (in 1,000's of units), and his dependent variable is the total cost of the lot (in $100's).Regression analysis of the data yielded the following tables.  Souros df SS MS F Regresssumm 1 9.858769 9.85876 12.22345 Retidual 11 8.872 0.806545 Total 12 78.73077
=0.898 =0.526341 The correlation coefficient between Louis's variables is ________________.
Souros df SS MS F Regresssumm 1 9.858769 9.85876 12.22345 Retidual 11 8.872 0.806545 Total 12 78.73077
=0.898 =0.526341 The correlation coefficient between Louis's variables is ________________.
(Multiple Choice)
4.9/5 (34)
A regression line minimizes the sum of the squared error values.This means that the regression line minimizes the sum of ______ from each point in the scatter point to the regression line.
(Multiple Choice)
4.9/5 (36)
If a scatter plot of variables X and Y shows a trend that can be summarized to a large degree by a straight line with slope 0.8 and y-intercept 0.2 (i.e., Y = 0.2 + 0.8X), then the correlation coefficient between X and Y is ______.
(Multiple Choice)
4.8/5 (38)
Filters
- Essay(0)
- Multiple Choice(0)
- Short Answer(0)
- True False(0)
- Matching(0)