Exam 12: Simple Regression Analysis and Correlation
Exam 1: Introduction to Statistics and Business Analytics180 Questions
Exam 2: Visualizing Data With Charts and Graphs113 Questions
Exam 3: Descriptive Statistics88 Questions
Exam 4: Probability104 Questions
Exam 5: Discrete Distributions98 Questions
Exam 6: Continuous Distributions105 Questions
Exam 7: Sampling and Sampling Distributions97 Questions
Exam 8: Statistical Inference: Estimation for Single Populations94 Questions
Exam 9: Statistical Inference: Hypothesis Testing for Single Populations123 Questions
Exam 10: Statistical Inferences About Two Populations97 Questions
Exam 11: Analysis of Variance and Design of Experiments133 Questions
Exam 12: Simple Regression Analysis and Correlation111 Questions
Exam 13: Multiple Regression Analysis90 Questions
Exam 14: Building Multiple Regression Models100 Questions
Exam 15: Time-Series Forecasting and Index Numbers103 Questions
Exam 16: Analysis of Categorical Data85 Questions
Exam 17: Nonparametric Statistics110 Questions
Exam 18: Statistical Quality Control99 Questions
Exam 19: Decision Analysis109 Questions
Select questions type
In the regression equation, ŷ=5.23+2.74x and n=24, the mean of x is 12.56, SSxx=55.87 and Se=10.71.A 90% confidence interval for y when x=11 is _________
(Multiple Choice)
4.9/5  (32)
(32)
Data points that lie apart from the rest of the points are called deviants.
(True/False)
4.8/5 (31)
The following data is to be used to construct a regression model: x 7 5 7 4 8 10 5 \gamma 5 4 5 4 7 10 8 The value of the intercept is ________.
(Multiple Choice)
4.8/5 (36)
In the regression equation, ŷ = 49.56 + 0.97x, the slope is _______.
(Multiple Choice)
4.8/5 (33)
A simple regression model developed for 12 pairs of data resulted in a sum of squares of error, SSE = 246.The standard error of the estimate is _______.
(Multiple Choice)
4.7/5 (34)
The proportion of variability of the dependent variable accounted for or explained by the independent variable is called the _______.
(Multiple Choice)
4.9/5 (32)
Louis Katz, a cost accountant at Papalote Plastics, Inc.(PPI), is analyzing the manufacturing costs of a molded plastic telephone handset produced by PPI.Louis's independent variable is production lot size (in 1,000's of units), and his dependent variable is the total cost of the lot (in $100's).Regression analysis of the data yielded the following tables.  Soures df SS MS F Regressjum 1 9.858769 9.858768 12.2234 Retidual 11 8.872 0.806545 Thtal 12 78.7077 =0.898 =0.526341 Using = 0.05, Louis should ________________.
(Multiple Choice)
4.8/5 (43)
A manager wishes to predict the annual cost (y)of an automobile based on the number of miles (x)driven.The following model was developed: ŷ = 2,000 + 0.42x.If a car is driven 20,000 miles, the predicted cost is ____________.
(Multiple Choice)
4.9/5 (43)
According to the following graphic, X and Y have _________. 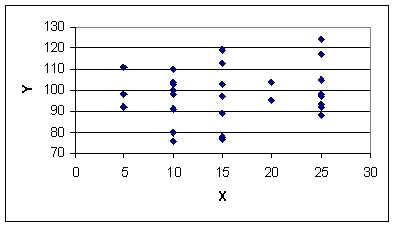
(Multiple Choice)
5.0/5 (35)
The following data is to be used to construct a regression model: x 3 5 7 4 8 10 9 y 5 4 5 4 .7 10 8 The value of the slope is ____________.
(Multiple Choice)
4.7/5 (32)
Filters
- Essay(0)
- Multiple Choice(0)
- Short Answer(0)
- True False(0)
- Matching(0)