Exam 18: Who Gets What the Distribution of Income
Exam 1: Economics and Economic Reasoning121 Questions
Exam 2: The Production Possibility Model, Trade, and Globalization111 Questions
Exam 3: Economic Institutions144 Questions
Exam 4: Supply and Demand151 Questions
Exam 5: Using Supply and Demand136 Questions
Exam 6: Describing Supply and Demand: Elasticities176 Questions
Exam 7: Taxation and Government Intervention169 Questions
Exam 8: Market Failure Versus Government Failure160 Questions
Exam 9: Comparative Advantage, Exchange Rates, and Globalization107 Questions
Exam 10: International Trade Policy82 Questions
Exam 11: Production and Cost Analysis I160 Questions
Exam 12: Production and Cost Analysis II129 Questions
Exam 13: Perfect Competition137 Questions
Exam 14: Monopoly and Monopolistic Competition231 Questions
Exam 15: Oligopoly and Antitrust Policy111 Questions
Exam 16: Real-World Competition and Technology86 Questions
Exam 17: Work and the Labor Market130 Questions
Exam 18: Who Gets What the Distribution of Income100 Questions
Exam 19: The Logic of Individual Choice: the Foundation of Supply and Demand134 Questions
Exam 20: Game Theory, Strategic Decision Making, and Behavioral Economics76 Questions
Exam 21: Thinking Like a Modern Economist67 Questions
Exam 22: Behavioral Economics and Modern Economic Policy87 Questions
Exam 23: Microeconomic Policy, Economic Reasoning, and Beyond111 Questions
Select questions type
Economic theory tells us that inequality in income is unfair if differences in opportunity leads to inequality of income.
(True/False)
4.7/5  (35)
(35)
Refer to the graph shown. 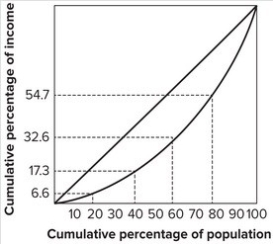 The middle quintile (the middle fifth) of families earn:
(Multiple Choice)
4.8/5 (36)
Which of the following Gini coefficients represents the income distribution closest to being equal?
(Multiple Choice)
4.9/5 (38)
One study of the distribution of wealth indicates that the bottom 40 percent of households hold 1 percent or less of total marketable wealth in the United States and the top 1 percent owns close to 40 percent of it. An economist might observe that these data do not include the value of human capital: the value of labor and skills embodied in a person. If we were to include human capital, which of the following people's net worth would change the most?
(Multiple Choice)
4.7/5 (39)
When most people talk about believing in equality of income, they mean they believe in equality of:
(Multiple Choice)
4.8/5 (38)
All of the following are examples of socioeconomic distribution of income except how much:
(Multiple Choice)
4.8/5 (46)
The three problems with determining whether an equal income distribution is fair include all of the following except:
(Multiple Choice)
4.9/5 (36)
Income is more unequally distributed than wealth in the United States.
(True/False)
5.0/5 (39)
If there were no income inequality in a nation, its Lorenz curve would be:
(Multiple Choice)
4.8/5 (37)
When former president Obama promised to raise taxes only on those whose income exceeds $250,000, he was suggesting the federal tax system be:
(Multiple Choice)
4.9/5 (34)
When taxation is proportional, the tax rate an individual pays:
(Multiple Choice)
4.8/5 (41)
The Lorenz curve would be a diagonal line if income were distributed equally.
(True/False)
4.8/5 (40)
Refer to the graph shown. 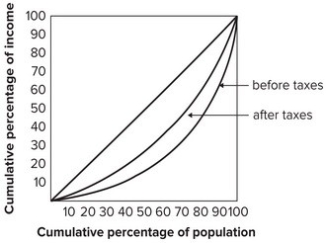 A possible explanation for the difference between the distribution of income before taxes and the distribution of income after taxes shown in the graph is that the tax system:
(Multiple Choice)
5.0/5 (33)
One study of the distribution of wealth indicates that the bottom 40 percent of households hold 1 percent or less of total marketable wealth in the United States. Which of the following people is most likely to be in the bottom 40 percent?
(Multiple Choice)
4.8/5 (30)
Filters
- Essay(0)
- Multiple Choice(0)
- Short Answer(0)
- True False(0)
- Matching(0)