Exam 18: Who Gets What the Distribution of Income
Exam 1: Economics and Economic Reasoning121 Questions
Exam 2: The Production Possibility Model, Trade, and Globalization111 Questions
Exam 3: Economic Institutions144 Questions
Exam 4: Supply and Demand151 Questions
Exam 5: Using Supply and Demand136 Questions
Exam 6: Describing Supply and Demand: Elasticities176 Questions
Exam 7: Taxation and Government Intervention169 Questions
Exam 8: Market Failure Versus Government Failure160 Questions
Exam 9: Comparative Advantage, Exchange Rates, and Globalization107 Questions
Exam 10: International Trade Policy82 Questions
Exam 11: Production and Cost Analysis I160 Questions
Exam 12: Production and Cost Analysis II129 Questions
Exam 13: Perfect Competition137 Questions
Exam 14: Monopoly and Monopolistic Competition231 Questions
Exam 15: Oligopoly and Antitrust Policy111 Questions
Exam 16: Real-World Competition and Technology86 Questions
Exam 17: Work and the Labor Market130 Questions
Exam 18: Who Gets What the Distribution of Income100 Questions
Exam 19: The Logic of Individual Choice: the Foundation of Supply and Demand134 Questions
Exam 20: Game Theory, Strategic Decision Making, and Behavioral Economics76 Questions
Exam 21: Thinking Like a Modern Economist67 Questions
Exam 22: Behavioral Economics and Modern Economic Policy87 Questions
Exam 23: Microeconomic Policy, Economic Reasoning, and Beyond111 Questions
Select questions type
Refer to the graph shown.  The Lorenz curve showing the most income equality is:
(Multiple Choice)
4.8/5  (38)
(38)
Which of the following statements is a correct interpretation of some economists' views?
(Multiple Choice)
4.9/5 (36)
Refer to the graph shown. 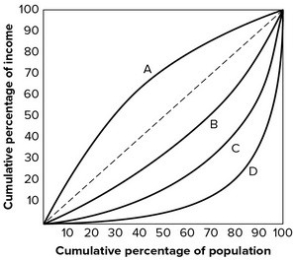 The Lorenz curve showing the most income inequality is
(Multiple Choice)
4.9/5 (36)
Because income differs so much by type of job, some economists argue that a new class distinction has emerged between:
(Multiple Choice)
4.9/5 (37)
Our ability to manage Social Security as a "pay-as-you-go" program (in which taxes collected from those currently working are used to make benefits payments to those currently retired) is impaired when the number of retirees per worker increases. The current concern about the stability of Social Security is based primarily on projections that there will many more retirees per worker when the baby boomers begin to retire. Then, if we want to maintain a pay-as-you-go system, we can:
(Multiple Choice)
4.9/5 (41)
Our ability to manage Social Security as a "pay-as-you-go" program (in which taxes collected from those currently working are used to make benefits payments to those currently retired) is impaired when the number of retirees per worker increases. The current concern about the stability of Social Security is based primarily on projections that there will many more retirees per worker as the baby boomers continue to retire. Then, if we want to maintain a pay-as-you-go system, we can:
(Multiple Choice)
4.9/5 (41)
A curve that shows the wealth distribution for the United States would be:
(Multiple Choice)
4.8/5 (44)
Today, the Gini coefficient of income inequality for the United States is about .5. In 1975, it had been about .4. What do these numbers tell us?
(Multiple Choice)
4.9/5 (31)
Bertrand de Juvenal's views on income distribution and fairness can best be described by the statement:
(Multiple Choice)
4.8/5 (31)
Refer to the graph shown. 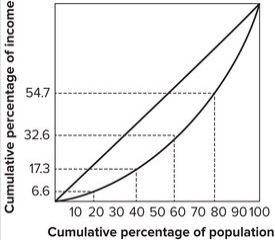 The top 20 percent of the families earn:
(Multiple Choice)
4.8/5 (41)
Refer to the following graph. 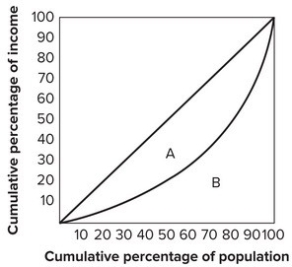 The Gini coefficient is calculated as area:
(Multiple Choice)
4.8/5 (29)
Refer to the graph shown. 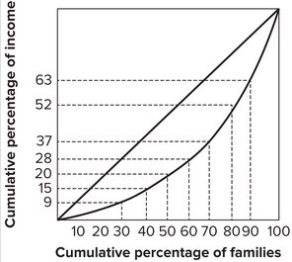 The poorest 30 percent of the families earn:
(Multiple Choice)
4.9/5 (38)
If the Lorenz curve becomes more outwardly bowed, it is also true that the number of families living in poverty:
(Multiple Choice)
4.7/5 (34)
All real-world Lorenz curves are below the diagonal line because income is always distributed unequally in the real world.
(True/False)
4.9/5 (45)
The United States has the least income inequality of all the nations in the world.
(True/False)
5.0/5 (41)
Filters
- Essay(0)
- Multiple Choice(0)
- Short Answer(0)
- True False(0)
- Matching(0)