Exam 3: Where Prices Come From: the Interaction of Demand and Supply
Exam 1: Economics: Foundations and Models459 Questions
Exam 2: Trade-Offs, Comparative Advantage, and the Market System492 Questions
Exam 3: Where Prices Come From: the Interaction of Demand and Supply476 Questions
Exam 4: Economic Efficiency, Government Price Setting, and Taxes420 Questions
Exam 5: Externalities, Environmental Policy, and Public Goods262 Questions
Exam 6: Elasticity: the Responsiveness of Demand and Supply293 Questions
Exam 7: The Economics of Health Care337 Questions
Exam 8: Firms, the Stock Market, and Corporate Governance512 Questions
Exam 9: Comparative Advantage and the Gains From International Trade377 Questions
Exam 10: Consumer Choice and Behavioral Economics304 Questions
Exam 11: Technology, Production, and Costs326 Questions
Exam 12: Firms in Perfectly Competitive Markets296 Questions
Exam 13: Monopolistic Competition: the Competitive Model in a More Realistic Setting272 Questions
Exam 14: Oligopoly: Firms in Less Competitive Markets256 Questions
Exam 15: Monopoly and Antitrust Policy279 Questions
Exam 16: Pricing Strategy258 Questions
Exam 17: The Markets for Labor and Other Factors of Production279 Questions
Exam 18: Public Choice, Taxes, and the Distribution of Income258 Questions
Exam 19: Gdp: Measuring Total Production and Income260 Questions
Exam 20: Unemployment and Inflation290 Questions
Exam 21: Economic Growth, the Financial System, and Business Cycles251 Questions
Exam 22: Long-Run Economic Growth: Sources and Policies261 Questions
Exam 23: Aggregate Expenditure and Output in the Short Run305 Questions
Exam 24: Aggregate Demand and Aggregate Supply Analysis286 Questions
Exam 25: Money, Banks, and the Federal Reserve System278 Questions
Exam 26: Monetary Policy280 Questions
Exam 27: Fiscal Policy313 Questions
Exam 28: Inflation, Unemployment, and Federal Reserve Policy257 Questions
Exam 29: Macroeconomics in an Open Economy277 Questions
Exam 30: The International Financial System258 Questions
Select questions type
Shrimp is an increasingly popular part of the American diet. Louisiana shrimpers who represent the bulk of the U.S. industry were almost all put out of business by Hurricane Katrina. How did the hurricane affect the equilibrium price and quantity of shrimp?
(Essay)
4.8/5  (39)
(39)
Figure 3-7 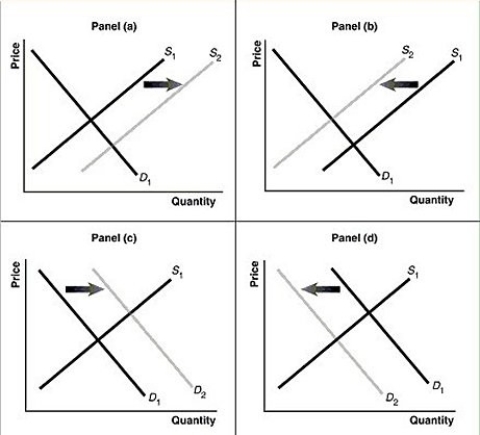 -Refer to Figure 3-7. Assume that the graphs in this figure represent the demand and supply curves for Fruitopia, a soft drink. Which panel describes what happens in the market for Fruitopia when the price of Snapple, a substitute product, decreases?
(Multiple Choice)
5.0/5 (36)
What would happen in the market for knee replacement surgery if insurance companies started to cover a smaller portion of the cost of the surgery, and fewer doctors decide to enter the field of joint replacement surgery?
(Multiple Choice)
4.9/5 (42)
Which of the following would shift the supply curve for MP3 players to the right?
(Multiple Choice)
4.9/5 (42)
If, for a product, the quantity supplied exceeds the quantity demanded, the market price will fall until
(Multiple Choice)
4.8/5 (40)
According to a recent study, "Stricter college alcohol policies, such as raising the price of alcohol, or banning alcohol on campus, decrease the number of students who use marijuana." On the basis of this information, how would you describe alcohol and marijuana?
(Multiple Choice)
4.8/5 (33)
Explain how it would be possible for the equilibrium price and equilibrium quantity to both increase in the market for motorcycles if consumer preference for motorcycles increases and the number of motorcycle manufacturers decreases.
(Essay)
4.8/5 (37)
What is the difference between a supply schedule and a supply curve?
(Essay)
4.8/5 (26)
Which of the following would cause an increase in the supply of peanut butter?
(Multiple Choice)
4.9/5 (33)
If a firm expects that the price of its product will be lower in the future than it is today
(Multiple Choice)
4.8/5 (29)
Orange juice drinkers want to consume more orange juice at a lower price. Which of the following events would have this effect?
(Multiple Choice)
4.9/5 (43)
Figure 3-7
-Refer to Figure 3-7. Assume that the graphs in this figure represent the demand and supply curves for frozen yogurt. Which panel describes what happens in the market for frozen yogurt when the price of ice cream, a substitute product, increases?
(Multiple Choice)
4.7/5 (33)
Which of the following has occurred as the millennial generation has come of age?
(Multiple Choice)
4.7/5 (28)
Discuss the correct and incorrect economic analysis in the following statements.
"If a disease kills a large number of turkeys, the supply of turkeys will decrease. This will result in a price increase, which will then cause the supply of turkeys to increase."
(Essay)
4.8/5 (39)
A positive technological change will cause the supply of a good to increase.
(True/False)
4.8/5 (35)
The cost of producing cigarettes in the United States has increased and at the same time, more and more Americans are choosing to not smoke cigarettes. Which of the following best explains the effect of these events in the cigarette market?
(Multiple Choice)
4.8/5 (29)
The law of demand implies, holding everything else constant, that as the price of gelato
(Multiple Choice)
4.8/5 (30)
Figure 3-8 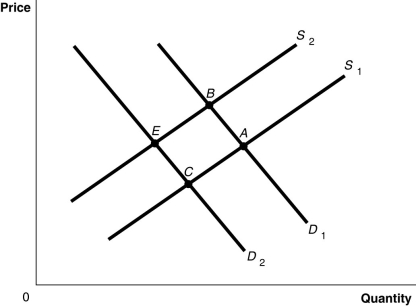 -Refer to Figure 3-8. The graph in this figure illustrates an initial competitive equilibrium in the market for motorcycles at the intersection of D1 and S2 (point B). Assume that Motorcycles are a normal good. If there is an increase in number of companies producing motorcycles and a decrease in income (assume motorcycles are a normal good), the equilibrium could move to which point?
(Multiple Choice)
4.7/5 (37)
If a decrease in income leads to an increase in the demand for macaroni, then macaroni is
(Multiple Choice)
4.7/5 (41)
Filters
- Essay(0)
- Multiple Choice(0)
- Short Answer(0)
- True False(0)
- Matching(0)