Exam 3: Where Prices Come From: the Interaction of Demand and Supply
Exam 1: Economics: Foundations and Models459 Questions
Exam 2: Trade-Offs, Comparative Advantage, and the Market System492 Questions
Exam 3: Where Prices Come From: the Interaction of Demand and Supply476 Questions
Exam 4: Economic Efficiency, Government Price Setting, and Taxes420 Questions
Exam 5: Externalities, Environmental Policy, and Public Goods262 Questions
Exam 6: Elasticity: the Responsiveness of Demand and Supply293 Questions
Exam 7: The Economics of Health Care337 Questions
Exam 8: Firms, the Stock Market, and Corporate Governance512 Questions
Exam 9: Comparative Advantage and the Gains From International Trade377 Questions
Exam 10: Consumer Choice and Behavioral Economics304 Questions
Exam 11: Technology, Production, and Costs326 Questions
Exam 12: Firms in Perfectly Competitive Markets296 Questions
Exam 13: Monopolistic Competition: the Competitive Model in a More Realistic Setting272 Questions
Exam 14: Oligopoly: Firms in Less Competitive Markets256 Questions
Exam 15: Monopoly and Antitrust Policy279 Questions
Exam 16: Pricing Strategy258 Questions
Exam 17: The Markets for Labor and Other Factors of Production279 Questions
Exam 18: Public Choice, Taxes, and the Distribution of Income258 Questions
Exam 19: Gdp: Measuring Total Production and Income260 Questions
Exam 20: Unemployment and Inflation290 Questions
Exam 21: Economic Growth, the Financial System, and Business Cycles251 Questions
Exam 22: Long-Run Economic Growth: Sources and Policies261 Questions
Exam 23: Aggregate Expenditure and Output in the Short Run305 Questions
Exam 24: Aggregate Demand and Aggregate Supply Analysis286 Questions
Exam 25: Money, Banks, and the Federal Reserve System278 Questions
Exam 26: Monetary Policy280 Questions
Exam 27: Fiscal Policy313 Questions
Exam 28: Inflation, Unemployment, and Federal Reserve Policy257 Questions
Exam 29: Macroeconomics in an Open Economy277 Questions
Exam 30: The International Financial System258 Questions
Select questions type
For each of the following pairs of products, state which are complements, which are substitutes, and which are unrelated.
a. House plants and potato chips
b. Eyeglasses and contact lenses
c. Motorcycles and gasoline
d. Smartphones and smartphone apps
e. Red wine and white wine
(Essay)
4.7/5  (31)
(31)
If the price of beef jerky rises, then the substitution effect due to the price change will cause
(Multiple Choice)
4.8/5 (31)
Table 3-3
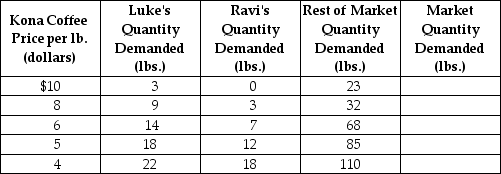 -Refer to Table 3-3. The table above shows the demand schedules for Kona coffee of two individuals (Luke and Ravi) and the rest of the market. If the price of Kona coffee falls from $6 to $4, the market quantity demanded would
(Multiple Choice)
4.8/5 (35)
Figure 3-8 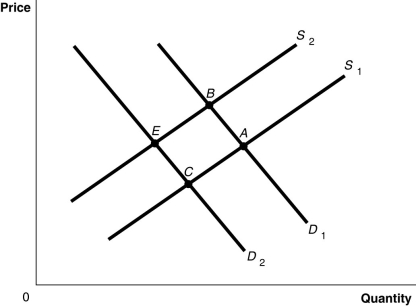 -Refer to Figure 3-8. The graph in this figure illustrates an initial competitive equilibrium in the market for apples at the intersection of D1 and S2 (point B). Which of the following changes would cause the equilibrium to change to point C?
(Multiple Choice)
4.8/5 (36)
If the demand for a product decreases and the supply of the same product increases, the equilibrium quantity will increase.
(True/False)
4.8/5 (37)
A firm has an incentive to decrease supply now and increase supply in the future if it expects that
(Multiple Choice)
4.7/5 (46)
An inferior good is a good for which the quantity demanded decreases as the price increases, holding everything else constant.
(True/False)
4.7/5 (34)
Figure 3-7 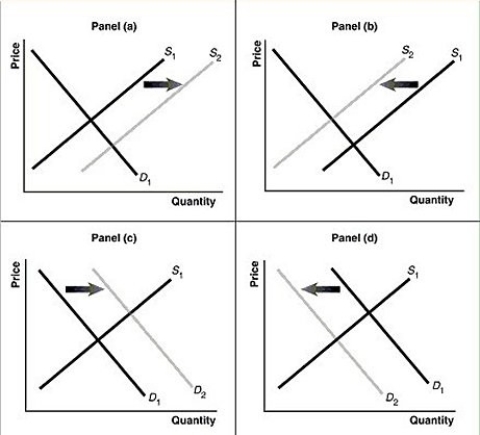 -Refer to Figure 3-7. Assume that the graphs in this figure represent the demand and supply curves for almonds. Which panel best describes what happens in this market when there is an increase in the productivity of almond harvesters?
(Multiple Choice)
5.0/5 (39)
Table 3-5
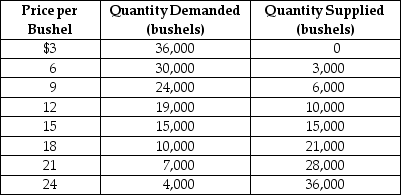 -Refer to Table 3-5. The table contains information about the corn market. Use the table to answer the following questions.
a. What are the equilibrium price and quantity of corn?
b. Suppose the prevailing price is $9 per bushel. Is there a shortage or a surplus in the market?
c. What is the quantity of the shortage or surplus?
d. How many bushels will be sold if the market price is $9 per bushel?
e. If the market price is $9 per bushel, what must happen to restore equilibrium in the market?
f. At what price will suppliers be able to sell 24,000 bushels of corn?
g. Suppose the market price is $21 per bushel. Is there a shortage or a surplus in the market?
h. What is the quantity of the shortage or surplus?
i. How many bushels will be sold if the market price is $21 per bushel?
j. If the market price is $21 per bushel, what must happen to restore equilibrium in the market?
-Refer to Table 3-5. The table contains information about the corn market. Use the table to answer the following questions.
a. What are the equilibrium price and quantity of corn?
b. Suppose the prevailing price is $9 per bushel. Is there a shortage or a surplus in the market?
c. What is the quantity of the shortage or surplus?
d. How many bushels will be sold if the market price is $9 per bushel?
e. If the market price is $9 per bushel, what must happen to restore equilibrium in the market?
f. At what price will suppliers be able to sell 24,000 bushels of corn?
g. Suppose the market price is $21 per bushel. Is there a shortage or a surplus in the market?
h. What is the quantity of the shortage or surplus?
i. How many bushels will be sold if the market price is $21 per bushel?
j. If the market price is $21 per bushel, what must happen to restore equilibrium in the market?
(Essay)
4.9/5 (32)
Figure 3-8
-Refer to Figure 3-8. The graph in this figure illustrates an initial competitive equilibrium in the market for motorcycles at the intersection of D1 and S1 (point A). If there is a surplus of motorcycles how will the equilibrium point change?
(Multiple Choice)
4.9/5 (40)
In July, market analysts predict that the price of gold will rise in August. What happens in the gold market in July, holding everything else constant?
(Multiple Choice)
4.9/5 (42)
During the 1990s positive technological change in the production of chicken caused the price of chicken to fall. Holding everything else constant, how would this affect the market for pork (a substitute for chicken)?
(Multiple Choice)
4.8/5 (27)
Which of the following will not shift the demand curve for a good?
(Multiple Choice)
4.8/5 (33)
Which of the following is evidence of a shortage of walnuts?
(Multiple Choice)
4.7/5 (35)
Select the phrase that correctly completes the following statement. "A positive change in technology caused an increase in the supply of flat-screen televisions. As a result ________."
(Multiple Choice)
4.8/5 (41)
Studies have shown that smoking cigarettes can cause heart disease. Assume this is true, and favorable weather has increased the tobacco harvest in North Carolina. In the market for cigarettes, these two developments would
(Multiple Choice)
4.9/5 (36)
Indicate whether each of the following situations would shift the supply curve to the left, to the right, or not at all.
a. An increase in the number of firms in the market
b. An increase in the current price of the product
c. A decrease in productivity
d. An increase in the expected future price of a product
e. A decrease in the price of an input
(Essay)
4.7/5 (32)
"The price of digital cameras fell because of improvements in production technology. As a result, the demand for non-digital cameras decreased. This caused the price of non-digital cameras to fall; as the price of non-digital cameras fell the demand for non-digital cameras decreased even further." Evaluate this statement.
(Multiple Choice)
4.9/5 (36)
Filters
- Essay(0)
- Multiple Choice(0)
- Short Answer(0)
- True False(0)
- Matching(0)