Exam 3: Where Prices Come From: the Interaction of Demand and Supply
Exam 1: Economics: Foundations and Models459 Questions
Exam 2: Trade-Offs, Comparative Advantage, and the Market System492 Questions
Exam 3: Where Prices Come From: the Interaction of Demand and Supply476 Questions
Exam 4: Economic Efficiency, Government Price Setting, and Taxes420 Questions
Exam 5: Externalities, Environmental Policy, and Public Goods262 Questions
Exam 6: Elasticity: the Responsiveness of Demand and Supply293 Questions
Exam 7: The Economics of Health Care337 Questions
Exam 8: Firms, the Stock Market, and Corporate Governance512 Questions
Exam 9: Comparative Advantage and the Gains From International Trade377 Questions
Exam 10: Consumer Choice and Behavioral Economics304 Questions
Exam 11: Technology, Production, and Costs326 Questions
Exam 12: Firms in Perfectly Competitive Markets296 Questions
Exam 13: Monopolistic Competition: the Competitive Model in a More Realistic Setting272 Questions
Exam 14: Oligopoly: Firms in Less Competitive Markets256 Questions
Exam 15: Monopoly and Antitrust Policy279 Questions
Exam 16: Pricing Strategy258 Questions
Exam 17: The Markets for Labor and Other Factors of Production279 Questions
Exam 18: Public Choice, Taxes, and the Distribution of Income258 Questions
Exam 19: Gdp: Measuring Total Production and Income260 Questions
Exam 20: Unemployment and Inflation290 Questions
Exam 21: Economic Growth, the Financial System, and Business Cycles251 Questions
Exam 22: Long-Run Economic Growth: Sources and Policies261 Questions
Exam 23: Aggregate Expenditure and Output in the Short Run305 Questions
Exam 24: Aggregate Demand and Aggregate Supply Analysis286 Questions
Exam 25: Money, Banks, and the Federal Reserve System278 Questions
Exam 26: Monetary Policy280 Questions
Exam 27: Fiscal Policy313 Questions
Exam 28: Inflation, Unemployment, and Federal Reserve Policy257 Questions
Exam 29: Macroeconomics in an Open Economy277 Questions
Exam 30: The International Financial System258 Questions
Select questions type
Assume that both the demand curve and the supply curve for MP3 players shift to the right but the supply curve shifts more than the demand curve. As a result
(Multiple Choice)
4.9/5  (41)
(41)
Figure 3-6 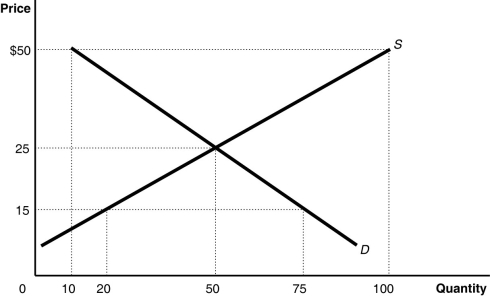 -Refer to Figure 3-6. The figure above represents the market for canvas tote bags. Compare the conditions in the market when the price is $50 and when the price is $35. Which of the following describes how the market differs at these prices?
(Multiple Choice)
4.9/5 (40)
Figure 3-1 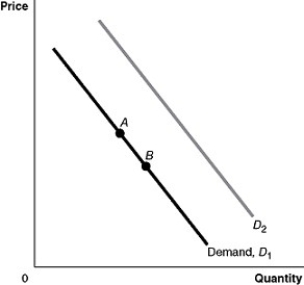 -Refer to Figure 3-1. An increase in population would be represented by a movement from
(Multiple Choice)
4.8/5 (36)
A decrease in the price of inputs will cause the supply curve for a product to shift to the right.
(True/False)
4.8/5 (39)
Figure 3-2 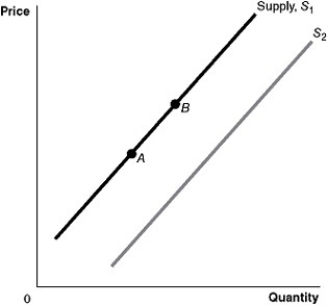 -Refer to Figure 3-2. A technological advancement would be represented by a movement from
(Multiple Choice)
4.9/5 (32)
Assume that airline tickets are a normal good. Prices of commercial airline tickets have fallen in recent months. Over this same period, the price of jet fuel has risen and consumer incomes have fallen. Which of the following best explains the falling prices of airline tickets?
(Multiple Choice)
4.8/5 (24)
Figure 3-8 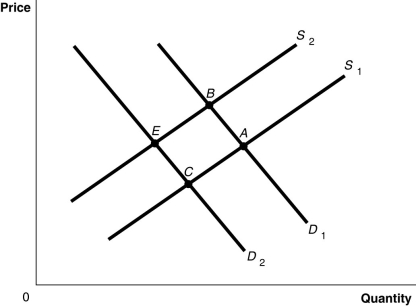 -Refer to Figure 3-8. The graph in this figure illustrates an initial competitive equilibrium in the market for apples at the intersection of D2 and S2 (point E). Which of the following changes would cause the equilibrium to change to point A?
(Multiple Choice)
4.8/5 (39)
Nearly one-fifth of China's 1.38 billion people are under the age of 15. How will this affect high school enrollment over the next fifteen years? The labor market over the next fifteen years?
(Essay)
4.9/5 (33)
A change in which variable will change the market demand for a product?
(Multiple Choice)
4.7/5 (34)
If the sales of carbonated sodas continue to decline as more cities impose soda taxes on these beverages, this will likely
(Multiple Choice)
4.8/5 (32)
Auctions in recent years have resulted in higher prices paid for letters written by John Wilkes Booth than those written by Abraham Lincoln. What is a reason for this difference in price?
(Multiple Choice)
4.7/5 (38)
Auctions in recent years have resulted in higher prices paid for letters written by John Wilkes Booth than those written by Abraham Lincoln. Which of the following events would cause the price differences in these letters to get smaller?
(Multiple Choice)
4.8/5 (28)
Studies have shown links between calcium consumption and a reduction in osteoporosis. How does this affect the market for calcium?
(Multiple Choice)
4.8/5 (40)
Let D = demand, S = supply, P = equilibrium price, Q = equilibrium quantity. What happens in the market for solar panels if the government offers tax breaks to encourage manufacturers to produce more solar panels?
(Multiple Choice)
4.9/5 (35)
Technological advances have resulted in lower prices for digital cameras. What is the impact of this on the market for traditional (non-digital) cameras?
(Multiple Choice)
5.0/5 (42)
Table 3-4
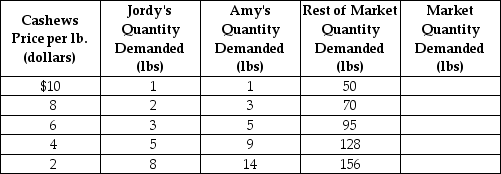 -Refer to Table 3-4. The table above shows the demand schedules for cashews of two individuals (Jordy and Amy) and the rest of the market. If the price of cashews rises from $4 to $6, the market quantity demanded would
(Multiple Choice)
4.8/5 (37)
Figure 3-5 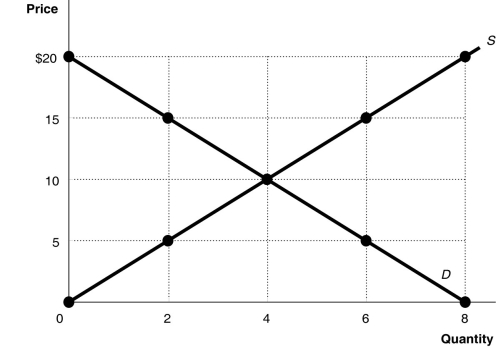 -Refer to Figure 3-5. At a price of $20, the quantity sold
(Multiple Choice)
4.8/5 (41)
Filters
- Essay(0)
- Multiple Choice(0)
- Short Answer(0)
- True False(0)
- Matching(0)