Exam 3: Where Prices Come From: the Interaction of Demand and Supply
Exam 1: Economics: Foundations and Models459 Questions
Exam 2: Trade-Offs, Comparative Advantage, and the Market System492 Questions
Exam 3: Where Prices Come From: the Interaction of Demand and Supply476 Questions
Exam 4: Economic Efficiency, Government Price Setting, and Taxes420 Questions
Exam 5: Externalities, Environmental Policy, and Public Goods262 Questions
Exam 6: Elasticity: the Responsiveness of Demand and Supply293 Questions
Exam 7: The Economics of Health Care337 Questions
Exam 8: Firms, the Stock Market, and Corporate Governance512 Questions
Exam 9: Comparative Advantage and the Gains From International Trade377 Questions
Exam 10: Consumer Choice and Behavioral Economics304 Questions
Exam 11: Technology, Production, and Costs326 Questions
Exam 12: Firms in Perfectly Competitive Markets296 Questions
Exam 13: Monopolistic Competition: the Competitive Model in a More Realistic Setting272 Questions
Exam 14: Oligopoly: Firms in Less Competitive Markets256 Questions
Exam 15: Monopoly and Antitrust Policy279 Questions
Exam 16: Pricing Strategy258 Questions
Exam 17: The Markets for Labor and Other Factors of Production279 Questions
Exam 18: Public Choice, Taxes, and the Distribution of Income258 Questions
Exam 19: Gdp: Measuring Total Production and Income260 Questions
Exam 20: Unemployment and Inflation290 Questions
Exam 21: Economic Growth, the Financial System, and Business Cycles251 Questions
Exam 22: Long-Run Economic Growth: Sources and Policies261 Questions
Exam 23: Aggregate Expenditure and Output in the Short Run305 Questions
Exam 24: Aggregate Demand and Aggregate Supply Analysis286 Questions
Exam 25: Money, Banks, and the Federal Reserve System278 Questions
Exam 26: Monetary Policy280 Questions
Exam 27: Fiscal Policy313 Questions
Exam 28: Inflation, Unemployment, and Federal Reserve Policy257 Questions
Exam 29: Macroeconomics in an Open Economy277 Questions
Exam 30: The International Financial System258 Questions
Select questions type
Draw a demand curve and label it D1. On the graph, illustrate an increase in demand and a decrease in demand, and label the curves D2 and D3, respectively. Starting on demand curve D1, explain the shift that would result from each of the following events:
a. an increase in income and the good is a normal good
b. an increase in income and the good is an inferior good
c. a decrease in the price of a substitute good
d. a decrease in the price of a complementary good
e. an increase in the taste for the good
f. a decrease in population
g. an increase in the expected future price of the good
(Essay)
4.9/5  (46)
(46)
The law of demand implies, holding everything else constant, that as the price of bagels increases
(Multiple Choice)
4.9/5 (37)
Figure 3-1 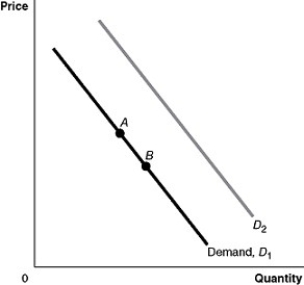 -Refer to Figure 3-1. If the product represented is a normal good, a decrease in income would be represented by a movement from
(Multiple Choice)
4.9/5 (39)
By drawing a demand curve with ________ on the vertical axis and ________ on the horizontal axis, economists assume that the most important determinant of the demand for a good is the ________ of the good.
(Multiple Choice)
4.8/5 (38)
An increase in the price of inputs will cause the supply curve for a product to shift to the right.
(True/False)
5.0/5 (41)
If a union successfully negotiates for higher wages and benefits for steel workers, what impact would this have on supply and demand in the market for steel, assuming no other changes take place in this market?
(Essay)
4.7/5 (34)
Draw a demand curve and label it D1. On the graph, illustrate an increase in demand and a decrease in demand, and label the curves D2 and D3, respectively. Starting on demand curve D1, explain the shift that would result from each of the following events:
a. a decrease in income and the good is a normal good
b. a decrease in income and the good is an inferior good
c. an increase in the price of a substitute good
d. an increase in the price of a complementary good
e. a decrease in the taste for the good
f. an increase in population
g. a decrease in the expected future price of the good
(Essay)
4.8/5 (44)
Figure 3-7 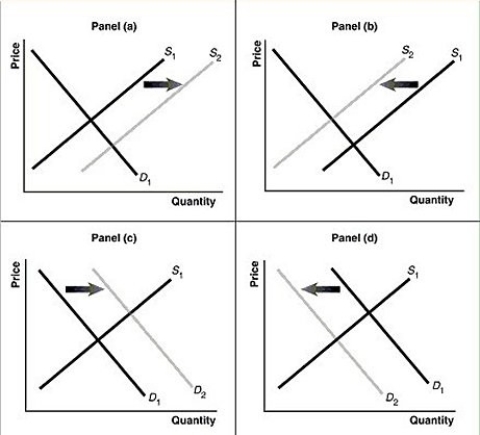 -Refer to Figure 3-7. Assume that the graphs in this figure represent the demand and supply curves for women's clothing. Which panel best describes what happens in this market when the wages of seamstresses rise?
(Multiple Choice)
4.9/5 (39)
The Internet has created a new category in the book selling market, namely, the "barely used" book. How does the availability of barely used books affect the market for new books?
(Multiple Choice)
4.7/5 (39)
Olive oil producers want to sell more olive oil at a higher price. Which of the following events would have this effect?
(Multiple Choice)
4.8/5 (43)
Holding everything else constant, an increase in the price of raisins will result in
(Multiple Choice)
4.9/5 (37)
For each of the following pairs of products, state which are complements, which are substitutes, and which are unrelated.
a. Swim fins and scuba tanks
b. Coca Cola and Volkswagens
c. Printers and ink cartridges
d. Ice and ice chests
e. Heineken and Corona
(Essay)
4.7/5 (28)
Market equilibrium occurs where the quantity supplied is equal to the quantity demanded.
(True/False)
4.9/5 (32)
An inferior good is a good for which the quantity demanded increases as the price decreases, holding everything else constant.
(True/False)
4.8/5 (36)
If the price of propane-fueled gas grills was to decrease, then
(Multiple Choice)
4.8/5 (32)
Figure 3-1
-Refer to Figure 3-1. A decrease in taste or preference would be represented by a movement from
(Multiple Choice)
4.8/5 (37)
In response to a shortage, the market price of a good will rise. As the price rises, the demand will decrease and supply will increase until equilibrium is reached.
(True/False)
4.7/5 (32)
Assume that the demand curve for DVD players shifts to the left and the supply curve for DVD players shifts to the right, but the supply curve shifts more than the demand curve. As a result
(Multiple Choice)
4.8/5 (39)
Filters
- Essay(0)
- Multiple Choice(0)
- Short Answer(0)
- True False(0)
- Matching(0)