Exam 2: Picturing Variation With Graphs
Exam 1: Introduction to Data60 Questions
Exam 2: Picturing Variation With Graphs60 Questions
Exam 3: Numerical Summaries of Center and Variation60 Questions
Exam 4: Regression Analysis: Exploring Associations Between Variables60 Questions
Exam 5: Modeling Variation With Probability60 Questions
Exam 6: Modeling Random Events: the Normal and Binomial Models60 Questions
Exam 7: Survey Sampling and Inference60 Questions
Exam 8: Hypothesis Testing for Population Proportions60 Questions
Exam 9: Inferring Population Means60 Questions
Exam 10: Associations Between Categorical Variables60 Questions
Exam 11: Multiple Comparisons and Analysis of Variance60 Questions
Exam 12: Experimental Design: Controlling Variation60 Questions
Exam 13: Inference Without Normality59 Questions
Exam 14: Inference for Regression60 Questions
Select questions type
The distribution of heights of adult females tends to be symmetrical.
(Multiple Choice)
4.9/5  (25)
(25)
The distribution of the numbers of times individuals in the 18- 24 age group log onto a social networking website during the course of a day tends to be right- skewed.
(Multiple Choice)
4.8/5 (29)
According to the histogram, about how many households do not own any cell phones?
(Essay)
4.9/5 (39)
The histogram below is the distribution of heights for a randomly selected Boy Scout troupe. Choose the statement that is true based on information from the histogram. 
(Multiple Choice)
4.9/5 (39)
A group of junior high athletes was asked what team sport was their favorite. The data are summarized in the table below. On the pie chart, which area would correspond to the category "Volleyball"? 
(Multiple Choice)
4.8/5 (41)
Which group is more likely to spend 8 hours or more on extracurricular athletic activities each week? Which group is more likely to spend 6 hours or less on extracurricular athletic activities each week?
(Essay)
4.8/5 (31)
The histogram shows the distribution of pitch speeds for a sample of 75 pitches for a college pitcher during one season. Which of the following statements best describes the distribution of the histogram below? 
(Multiple Choice)
4.8/5 (35)
The graph below displays the number of homicides in the city of Flint, Michigan for each of the last three years. A reported interprets this graph to mean that the number of murders in 2010 was more than twice the number of murders in 2008. Is the reporter making a correct interpretation? 
(Multiple Choice)
4.9/5 (31)
The distribution of test scores for a group of adults on a written driving exam following a refresher course tends to be left- skewed.
(Multiple Choice)
4.9/5 (36)
Define the important features to look for when presented with a numerical distribution.
(Essay)
4.7/5 (37)
Each day for twenty days a record store owner counts the number of customers who purchase an album by a certain artist. The data and a dotplot of the data are shown below: Data set: 1, 3, 4, 4, 5, 6, 7, 2, 3, 4, 4, 5, 6, 8, 2, 3, 4, 5, 6, 7, 9
 Which of the following statements can be made using the given information?
(Multiple Choice)
4.8/5 (35)
About what percentage of households own no more than three cell phones?
(Essay)
4.8/5 (38)
Based on the histogram below, would it be unusual to be on hold for 5 minutes or more at this call center? 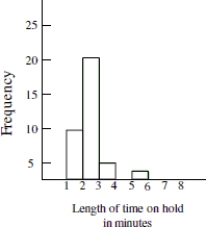
(Multiple Choice)
4.8/5 (36)
A used car salesman decides to track the number of cars he sold each week for the past twelve months. Typically, the salesman sells 13 cars per week. During an usually slow week he sold only 2 cars, but during his best week he sold 29 cars. Predict the shape of the histogram of the number of cars sold each week.
(Essay)
4.8/5 (38)
Which category shows the least amount of variation between years?
(Multiple Choice)
4.7/5 (33)
About what percent of girls spent 5 hours or less on extracurricular athletic activities each week? Round to the nearest whole percent.
(Short Answer)
4.8/5 (38)
You have created a histogram showing the distribution of the amount of money spent weekly on video game purchases of 120 males ages 19- 25 over the last 6 months. The histogram shows that the typical amount spent by males in this age category is $35. The histogram also shows that one male reported that he spent $250 dollars on video game purchases during one of the weeks. Explain how you would use the histogram to determine whether $250 is an outlier.
(Essay)
4.7/5 (40)
What percentage of the participants had a heart rate greater than 130 bpm?
(Multiple Choice)
4.7/5 (42)
Filters
- Essay(0)
- Multiple Choice(0)
- Short Answer(0)
- True False(0)
- Matching(0)