Exam 17: Decision Making
Exam 1: Introduction and Data Collection137 Questions
Exam 2: Presenting Data in Tables and Charts181 Questions
Exam 3: Numerical Descriptive Measures138 Questions
Exam 4: Basic Probability152 Questions
Exam 5: Some Important Discrete Probability Distributions174 Questions
Exam 6: The Normal Distribution and Other Continuous Distributions180 Questions
Exam 7: Sampling Distributions and Sampling180 Questions
Exam 8: Confidence Interval Estimation185 Questions
Exam 9: Fundamentals of Hypothesis Testing: One-Sample Tests180 Questions
Exam 10: Two-Sample Tests184 Questions
Exam 11: Analysis of Variance179 Questions
Exam 12: Chi-Square Tests and Nonparametric Tests206 Questions
Exam 13: Simple Linear Regression196 Questions
Exam 14: Introduction to Multiple Regression258 Questions
Exam 15: Multiple Regression Model Building88 Questions
Exam 16: Time-Series Forecasting and Index Numbers193 Questions
Exam 17: Decision Making127 Questions
Exam 18: Statistical Applications in Quality Management113 Questions
Exam 19: Statistical Analysis Scenarios and Distributions82 Questions
Select questions type
A firm wishing to maximize profits will increase production as long as expected marginal profit exceeds expected marginal loss.
Free
(True/False)
4.9/5  (30)
(30)
Correct Answer: Verified
True
TABLE 17-6
A student wanted to find out the optimal strategy to study for a Business Statistics exam. He constructed the following payoff table based on the average amount of time he needed to put in every week studying for the course and the degree of difficulty of the exam. From the information that he gathered from students who had taken the course, he concluded that there was a 40% probability that the exam would be easy.
16 hours 8 hours 4 hours Easy Exam 40 60 80 Difficult Exam 100 50 0
-Referring to Table 17-6, what would be the expected profit if the student had perfect information on whether the exam will be easy or difficult?
Free
(Short Answer)
4.7/5 (46)
Correct Answer:Verified
92
TABLE 17-6
A student wanted to find out the optimal strategy to study for a Business Statistics exam. He constructed the following payoff table based on the average amount of time he needed to put in every week studying for the course and the degree of difficulty of the exam. From the information that he gathered from students who had taken the course, he concluded that there was a 40% probability that the exam would be easy.
16 hours 8 hours 4 hours Easy Exam 40 60 80 Difficult Exam 100 50 0
-Referring to Table 17-6, how many possible states of the world are there?
Free
(Short Answer)
4.8/5 (33)
Correct Answer:Verified
2
Look at the utility function graphed below and select the type of decision maker that corresponds to the graph. 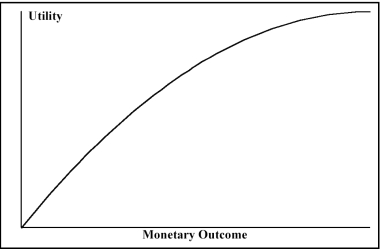
(Multiple Choice)
4.9/5 (46)
TABLE 17-6
A student wanted to find out the optimal strategy to study for a Business Statistics exam. He constructed the following payoff table based on the average amount of time he needed to put in every week studying for the course and the degree of difficulty of the exam. From the information that he gathered from students who had taken the course, he concluded that there was a 40% probability that the exam would be easy.
16 hours 8 hours 4 hours Easy Exam 40 60 80 Difficult Exam 100 50 0
-Referring to Table 17-6, what is the opportunity loss of spending 8 hours per week on average studying for the exam when the exam turns out to be difficult?
(Short Answer)
4.8/5 (38)
TABLE 17-6
A student wanted to find out the optimal strategy to study for a Business Statistics exam. He constructed the following payoff table based on the average amount of time he needed to put in every week studying for the course and the degree of difficulty of the exam. From the information that he gathered from students who had taken the course, he concluded that there was a 40% probability that the exam would be easy.
16 hours 8 hours 4 hours Easy Exam 40 60 80 Difficult Exam 100 50 0
-Referring to Table 17-6, the optimal strategy using the maximax criterion is to study 8 hours per week on average for the exam.
(True/False)
4.8/5 (32)
TABLE 17-1
The following payoff table shows profits associated with a set of 3 alternatives under 2 possible states of nature.
States A1 A2 A3 1 12 -2 8 2 4 10 5
-Referring to Table 17-1, if the probability of S1 is 0.5, what is the EVPI for the payoff table?
(Multiple Choice)
4.8/5 (47)
Blossom's Flowers purchases roses for sale for Valentine's Day. The roses are purchased for $10 a dozen and are sold for $20 a dozen. Any roses not sold on Valentine's Day can be sold for $5 per dozen. The owner will purchase 1 of 3 amounts of roses for Valentine's Day: 100, 200, or 400 dozen roses. What is the number of states of nature for the payoff table?
(Multiple Choice)
4.8/5 (27)
TABLE 17-5
The following payoff table shows profits associated with a set of 2 alternatives under 3 possible events.
Event A B 1 1000 1200 2 500 700 3 300 -200
Suppose that the probability of Event 1 is 0.2, Event 2 is 0.5, and Event 3 is 0.3.
-Referring to Table 17-5, what is the optimal action using EMV?
(Short Answer)
4.7/5 (41)
At Eastern University, 60% of the students are from suburban areas, 30% are from rural areas, and 10% are from urban areas. Of the students from the suburban areas, 60% are nonbusiness majors. Of the students from the rural areas, 70% are nonbusiness majors. Of the students from the urban areas, 90% are nonbusiness majors. If a randomly selected student is not a business major, what is the probability that the student is from the urban area?
(Multiple Choice)
4.9/5 (37)
TABLE 17-4
A stock portfolio has the following returns under the market conditions listed below.
Market Condition Probability Return Bull 0.4 \ 200 Stable 0.3 \ 100 Bear 0.3 -\ 100
-Referring to Table 17-4, what is the return to risk ratio?
(Multiple Choice)
4.9/5 (33)
A company that manufactures designer jeans is contemplating whether to increase its advertising budget by $1 million for next year. If the expanded advertising campaign is successful, the company expects sales to increase by $1.6 million next year. If the advertising campaign fails, the company expects sales to increase by only $400,000 next year. If the advertising budget is not increased, the company expects sales to increase by $200,000. Identify the states of nature in this decision-making problem.
(Multiple Choice)
4.9/5 (37)
TABLE 17-5
The following payoff table shows profits associated with a set of 2 alternatives under 3 possible events.
Event A B 1 1000 1200 2 500 700 3 300 -200
Suppose that the probability of Event 1 is 0.2, Event 2 is 0.5, and Event 3 is 0.3.
-Referring to Table 17-5, what is the optimal action using maximin criterion?
(Short Answer)
4.7/5 (28)
TABLE 17-6
A student wanted to find out the optimal strategy to study for a Business Statistics exam. He constructed the following payoff table based on the average amount of time he needed to put in every week studying for the course and the degree of difficulty of the exam. From the information that he gathered from students who had taken the course, he concluded that there was a 40% probability that the exam would be easy.
16 hours 8 hours 4 hours Easy Exam 40 60 80 Difficult Exam 100 50 0
-Referring to Table 17-6, what is the expected value of perfect information?
(Short Answer)
4.8/5 (28)
TABLE 17-3
The following information is from 2 investment opportunities.
A B Expected monetary value \ 900 \ 600 Standard deviation 100 50
-Referring to Table 17-3, which investment has the optimal coefficient of variation?
(Multiple Choice)
4.9/5 (38)
TABLE 17-6
A student wanted to find out the optimal strategy to study for a Business Statistics exam. He constructed the following payoff table based on the average amount of time he needed to put in every week studying for the course and the degree of difficulty of the exam. From the information that he gathered from students who had taken the course, he concluded that there was a 40% probability that the exam would be easy.
16 hours 8 hours 4 hours Easy Exam 40 60 80 Difficult Exam 100 50 0
-Referring to Table 17-6, the optimal strategy using the return-to-risk ratio criterion is to study 8 hours per week on average for the exam.
(True/False)
4.8/5 (36)
The risk-______ curve represents the expected monetary value approach.
(Short Answer)
4.8/5 (35)
TABLE 17-6
A student wanted to find out the optimal strategy to study for a Business Statistics exam. He constructed the following payoff table based on the average amount of time he needed to put in every week studying for the course and the degree of difficulty of the exam. From the information that he gathered from students who had taken the course, he concluded that there was a 40% probability that the exam would be easy.
16 hours 8 hours 4 hours Easy Exam 40 60 80 Difficult Exam 100 50 0
-Referring to Table 17-6, the optimal strategy using the expected monetary value criterion is to study 16 hours per week on average for the exam.
(True/False)
4.8/5 (37)
TABLE 17-2
The following payoff matrix is given in dollars.
Event A B 1 400 700 2 200 500
Suppose the probability of Event 1 is 0.5 and Event 2 is 0.5.
-Referring to Table 17-2, what is the action with the preferable coefficient of variation?
(Multiple Choice)
4.8/5 (37)
TABLE 17-2
The following payoff matrix is given in dollars.
Event A B 1 400 700 2 200 500
Suppose the probability of Event 1 is 0.5 and Event 2 is 0.5.
-Referring to Table 17-2, what is the best action using the maximin criterion?
(Multiple Choice)
5.0/5 (33)
Filters
- Essay(0)
- Multiple Choice(0)
- Short Answer(0)
- True False(0)
- Matching(0)