Exam 18: Statistical Applications in Quality Management
Exam 1: Introduction and Data Collection137 Questions
Exam 2: Presenting Data in Tables and Charts181 Questions
Exam 3: Numerical Descriptive Measures138 Questions
Exam 4: Basic Probability152 Questions
Exam 5: Some Important Discrete Probability Distributions174 Questions
Exam 6: The Normal Distribution and Other Continuous Distributions180 Questions
Exam 7: Sampling Distributions and Sampling180 Questions
Exam 8: Confidence Interval Estimation185 Questions
Exam 9: Fundamentals of Hypothesis Testing: One-Sample Tests180 Questions
Exam 10: Two-Sample Tests184 Questions
Exam 11: Analysis of Variance179 Questions
Exam 12: Chi-Square Tests and Nonparametric Tests206 Questions
Exam 13: Simple Linear Regression196 Questions
Exam 14: Introduction to Multiple Regression258 Questions
Exam 15: Multiple Regression Model Building88 Questions
Exam 16: Time-Series Forecasting and Index Numbers193 Questions
Exam 17: Decision Making127 Questions
Exam 18: Statistical Applications in Quality Management113 Questions
Exam 19: Statistical Analysis Scenarios and Distributions82 Questions
Select questions type
Determining the root causes of why defects can occur along with the variables in the process that cause these defects to occur involves which part of the DMAIC process?
Free
(Multiple Choice)
4.8/5  (47)
(47)
Correct Answer: Verified
C
TABLE 18-8
Recently, a university switched to a new type of computer-based registration. The registrar is concerned with the amount of time students are spending on the computer registering under the new system. She decides to randomly select 8 students on each of the 12 days of the registration and determine the time each spends on the computer registering. The range, mean, and standard deviation of the times required to register are in the table that follows.
Day Range Mean Std.Dev. 1 10 5.250 3.4949 2 31 15.250 10.3060 3 13 20.375 4.9262 4 21 22.875 8.3911 5 35 8.500 11.3767 6 18 7.875 6.9372 7 25 11.250 8.5815 8 30 7.875 9.5235 9 17 10.250 6.3640 10 22 9.500 7.8740 11 27 7.875 8.7086 12 26 12.875 9.3723
-Referring to Table 18-8, based on the X chart, it appears that the process is in control.
Free
(True/False)
4.9/5 (24)
Correct Answer:Verified
False
TABLE 18-8
Recently, a university switched to a new type of computer-based registration. The registrar is concerned with the amount of time students are spending on the computer registering under the new system. She decides to randomly select 8 students on each of the 12 days of the registration and determine the time each spends on the computer registering. The range, mean, and standard deviation of the times required to register are in the table that follows.
Day Range Mean Std.Dev. 1 10 5.250 3.4949 2 31 15.250 10.3060 3 13 20.375 4.9262 4 21 22.875 8.3911 5 35 8.500 11.3767 6 18 7.875 6.9372 7 25 11.250 8.5815 8 30 7.875 9.5235 9 17 10.250 6.3640 10 22 9.500 7.8740 11 27 7.875 8.7086 12 26 12.875 9.3723
-Referring to Table 18-8, construct an R chart for the time required to register.
Free
(Essay)
4.8/5 (30)
Correct Answer:Verified
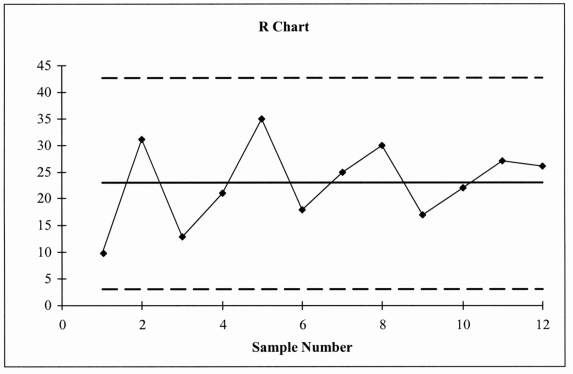
TABLE 18-4
A factory supervisor is concerned that the time it takes workers to complete an important production task (measured in seconds) is too erratic and adversely affects expected profits. The supervisor proceeds by randomly sampling 5 individuals per hour for a period of 10 hours. The sample mean and range for each hour are listed below.
Hour R 1 18.4 25 2 16.9 27 3 23.0 30 4 21.2 23 5 21.0 24 6 24.0 25 7 19.3 12 8 15.8 14 9 20.0 13 10 23.0 11
She also decides that lower and upper specification limit for the critical-to-quality variable should be 10 and 30 seconds, respectively.
-Referring to Table 18-4, what is the value of the Cpk index?
(Short Answer)
4.8/5 (41)
Common causes of variation are correctable without modifying the system.
(True/False)
4.8/5 (32)
TABLE 18-3
A quality control analyst for a light bulb manufacturer is concerned that the time it takes to produce a batch of light bulbs is too erratic. Accordingly, the analyst randomly surveys 10 production periods each day for 14 days and records the sample mean and range for each day.
Day (in minutes) 1 58.5 5.1 2 47.6 7.8 3 64.3 6.1 4 60.6 5.7 5 63.7 6.2 6 57.5 6.0 7 55.0 5.4 8 54.9 6.1 9 55.0 5.9 10 62.7 5.0 11 61.9 7.1 12 60.0 6.5 13 58.3 5.9 14 52.0 5.2
-Referring to Table 18-3, suppose the analyst constructs an X chart to see if the production process is in-control. Which expression best describes this chart?
(Multiple Choice)
4.9/5 (25)
TABLE 18-8
Recently, a university switched to a new type of computer-based registration. The registrar is concerned with the amount of time students are spending on the computer registering under the new system. She decides to randomly select 8 students on each of the 12 days of the registration and determine the time each spends on the computer registering. The range, mean, and standard deviation of the times required to register are in the table that follows.
Day Range Mean Std.Dev. 1 10 5.250 3.4949 2 31 15.250 10.3060 3 13 20.375 4.9262 4 21 22.875 8.3911 5 35 8.500 11.3767 6 18 7.875 6.9372 7 25 11.250 8.5815 8 30 7.875 9.5235 9 17 10.250 6.3640 10 22 9.500 7.8740 11 27 7.875 8.7086 12 26 12.875 9.3723
-Referring to Table 18-8, an chart is to be used for the time required to register. The center line of this chart is located at ______.
(Short Answer)
4.9/5 (27)
Which famous statistician developed the 14 Points of Quality?
(Multiple Choice)
4.8/5 (34)
TABLE 18-4
A factory supervisor is concerned that the time it takes workers to complete an important production task (measured in seconds) is too erratic and adversely affects expected profits. The supervisor proceeds by randomly sampling 5 individuals per hour for a period of 10 hours. The sample mean and range for each hour are listed below.
Hour R 1 18.4 25 2 16.9 27 3 23.0 30 4 21.2 23 5 21.0 24 6 24.0 25 7 19.3 12 8 15.8 14 9 20.0 13 10 23.0 11 She also decides that lower and upper specification limit for the critical-to-quality variable should be 10 and 30 seconds, respectively.
-Referring to Table 18-4, suppose the supervisor constructs an chart to see if the process is in-control. Which expression best describes this chart?
(Multiple Choice)
5.0/5 (29)
TABLE 18-4
A factory supervisor is concerned that the time it takes workers to complete an important production task (measured in seconds) is too erratic and adversely affects expected profits. The supervisor proceeds by randomly sampling 5 individuals per hour for a period of 10 hours. The sample mean and range for each hour are listed below.
Hour R 1 18.4 25 2 16.9 27 3 23.0 30 4 21.2 23 5 21.0 24 6 24.0 25 7 19.3 12 8 15.8 14 9 20.0 13 10 23.0 11
She also decides that lower and upper specification limit for the critical-to-quality variable should be 10 and 30 seconds, respectively.
-Referring to Table 18-4, suppose the supervisor constructs an X chart to see if the process is in-control. What are the lower and upper control limits of this chart?
(Multiple Choice)
4.9/5 (34)
A manufacturer of computer disks took samples of 240 disks on 15 consecutive days. The number of disks with bad sectors was determined for each of these samples. The results are in the table that follows.
Day Bad \% Bad 1 9 0.037500 2 7 0.029167 3 4 0.016667 4 6 0.025000 5 8 0.033333 6 3 0.012500 7 6 0.025000 8 10 0.041667 9 16 0.066667 10 24 0.100000 11 15 0.062500 12 9 0.037500 13 4 0.016667 14 8 0.033333 15 6 0.025000
-Referring to Table 18-5, a p control chart is to be made for these data. The upper control limit is_____ , and the lower control limit is ______.
(Short Answer)
4.8/5 (33)
TABLE 18-3
A quality control analyst for a light bulb manufacturer is concerned that the time it takes to produce a batch of light bulbs is too erratic. Accordingly, the analyst randomly surveys 10 production periods each day for 14 days and records the sample mean and range for each day.
Day (in minutes) R 1 58.5 5.1 2 47.6 7.8 3 64.3 6.1 4 60.6 5.7 5 63.7 6.2 6 57.5 6.0 7 55.0 5.4 8 54.9 6.1 9 55.0 5.9 10 62.7 5.0 11 61.9 7.1 12 60.0 6.5 13 58.3 5.9 14 52.0 5.2
-Referring to Table 18-3, suppose the sample mean and range data were based on 11 observations per day instead of 10. How would this change affect the lower and upper control limits of the R chart?
(Multiple Choice)
4.8/5 (39)
TABLE 18-5
A manufacturer of computer disks took samples of 240 disks on 15 consecutive days. The number of disks with bad sectors was determined for each of these samples. The results are in the table that follows.
Day Bad \% Bad 1 9 0037500 2 7 0.029167 3 4 0.016667 4 6 0.025000 5 8 0.033333 6 3 0.012500 7 6 0.025000 8 10 0.041667 9 16 0.066667 10 24 0.100000 11 15 0.062500 12 9 0.037500 13 4 0.016667 14 8 0.033333 15 6 0.025000
-Referring to Table 18-5, a p control chart is to be made for these data. The center line of the control chart is _____ .
(Short Answer)
4.8/5 (38)
TABLE 18-3
A quality control analyst for a light bulb manufacturer is concerned that the time it takes to produce a batch of light bulbs is too erratic. Accordingly, the analyst randomly surveys 10 production periods each day for 14 days and records the sample mean and range for each day.
Day (in minutes) R 1 58.5 5.1 2 47.6 7.8 3 64.3 6.1 4 60.6 5.7 5 63.7 6.2 6 57.5 6.0 7 55.0 5.4 8 54.9 6.1 9 55.0 5.9 10 62.7 5.0 11 61.9 7.1 12 60.0 6.5 13 58.3 5.9 14 52.0 5.2
-Referring to Table 18-3, suppose the analyst constructs an R chart to see if the variability in production times is in-control. The R chart is characterized by which of the following?
(Multiple Choice)
4.8/5 (34)
TABLE 18-3
A quality control analyst for a light bulb manufacturer is concerned that the time it takes to produce a batch of light bulbs is too erratic. Accordingly, the analyst randomly surveys 10 production periods each day for 14 days and records the sample mean and range for each day.
Day (in minutes) R 1 58.5 5.1 2 47.6 7.8 3 64.3 6.1 4 60.6 5.7 5 63.7 6.2 6 57.5 6.0 7 55.0 5.4 8 54.9 6.1 9 55.0 5.9 10 62.7 5.0 11 61.9 7.1 12 60.0 6.5 13 58.3 5.9 14 52.0 5.2
-Referring to Table 18-3, suppose the analyst constructs an R chart to see if the variability in production times is in-control. What is the upper control limit for this R chart?
(Multiple Choice)
4.8/5 (36)
TABLE 18-7
A supplier of silicone sheets for producers of computer chips wants to evaluate her manufacturing process. She takes samples of size 5 from each day's output and counts the number of blemishes on each silicone sheet. The results from 20 days of such evaluations are presented below.
Sheet
Day 1 2 3 4 5 Mean Range 1 8 10 14 6 5 8.6 9 2 8 13 6 6 10 8.6 7 3 10 12 7 7 9 9.0 5 4 5 9 12 7 10 8.6 7 5 8 3 8 9 10 7.6 7 6 9 7 9 6 9 8.0 3 7 10 10 5 7 6 7.6 5 8 10 9 10 6 5 8.0 5 9 6 10 6 9 9 8.0 4 10 6 9 8 6 8 7.4 3 11 8 5 6 10 10 7.8 5 12 6 4 7 7 12 7.2 8 13 7 5 7 6 9 6.8 4 14 5 8 8 7 6 6.8 3 15 7 12 10 6 10 9.0 6 16 7 11 4 7 8 7.4 7 17 8 4 5 4 7 5.6 4 18 11 4 11 11 10 9.4 7 19 6 10 6 10 10 8.4 4 20 6 12 12 6 8 8.8 6
She also decides that the upper specification limit is 10 blemishes.
-Referring to Table 18-7, an chart is to be used for the number of blemishes. The center line of this chart is located at ______.
(Short Answer)
4.9/5 (40)
TABLE 18-2
A political pollster randomly selects a sample of 100 voters each day for 8 successive days and asks how many will vote for the incumbent. The pollster wishes to construct a p chart to see if the percentage favoring the incumbent candidate is too erratic.
Sample Number Favoring (Day) Incumbent Candidate 1 57 2 57 3 53 4 51 5 55 6 60 7 56 8 59
-Referring to Table 18-2, what is the numerical value of the upper control limit for the p chart?
(Multiple Choice)
4.8/5 (31)
The cause of variation that can be reduced only by changing the system is ______ cause variation.
(Short Answer)
4.9/5 (31)
The principal focus of the control chart is the attempt to separate special or assignable causes of variation from common causes of variation. What cause of variation can be reduced only by changing the system?
(Multiple Choice)
4.8/5 (36)
TABLE 18-2
A political pollster randomly selects a sample of 100 voters each day for 8 successive days and asks how many will vote for the incumbent. The pollster wishes to construct a p chart to see if the percentage favoring the incumbent candidate is too erratic.
Sample Number Favoring (Day) Incumbent Candidate 1 57 2 57 3 53 4 51 5 55 6 60 7 56 8 59
-Referring to Table 18-2, what is the numerical value of the lower control limit for the p chart?
(Multiple Choice)
4.8/5 (39)
Filters
- Essay(0)
- Multiple Choice(0)
- Short Answer(0)
- True False(0)
- Matching(0)