Exam 6: Introduction to Macroeconomics and Gross Domestic Product
Exam 1: Five Foundations of Economics 170 Questions
Exam 2: Model Building and Gains From Trade173 Questions
Exam 3: The Market at Work: Supply and Demand172 Questions
Exam 4: Market Outcomes and Tax Incidence170 Questions
Exam 5: Price Controls164 Questions
Exam 6: Introduction to Macroeconomics and Gross Domestic Product167 Questions
Exam 7: Unemployment173 Questions
Exam 8: The Price Level and Inflation174 Questions
Exam 9: Savings, Interest Rates, and the Market for Loanable Funds175 Questions
Exam 10: Financial Markets and Securities169 Questions
Exam 11: Economic Growth and the Wealth of Nations174 Questions
Exam 12: Growth Theory172 Questions
Exam 13: The Aggregate Demandaggregate Supply Model175 Questions
Exam 14: The Great Recession, the Great Depression, and Great Macroeconomic Debates175 Questions
Exam 15: Federal Budgets: the Tools of Fiscal Policy175 Questions
Exam 16: Fiscal Policy169 Questions
Exam 17: Money and the Federal Reserve174 Questions
Exam 18: Monetary Policy Learning Objectives169 Questions
Exam 19: International Trade173 Questions
Exam 20: International Finance175 Questions
Select questions type
Consider the following figure to answer the next questions:
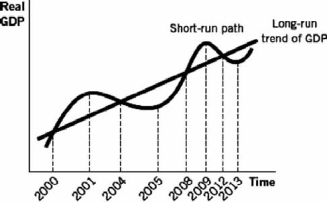 -During which period was the economy in an expansion?
Free
(Multiple Choice)
4.8/5  (33)
(33)
Correct Answer: Verified
A
Company X sells paper to company Y for $100,000. Company Y uses the paper to make textbooks, selling them to consumers for $500,000. The total contribution to gross domestic product GDP) is
Free
(Multiple Choice)
4.8/5 (38)
Correct Answer:Verified
A
Which country has seen a decline in per capita gross domestic product GDP) since the 1970s?
Free
(Multiple Choice)
4.7/5 (29)
Correct Answer:Verified
C
Consider the following data that gives the quantity produced and unit price for three different goods across two different years to answer the questions. Assume that the base year is 2012. Good 2012 Price 2012 Quantity 2013 Price 2013 Quantity A \ 2.00 500 \ 2.50 600 B \ 4.00 1,000 \ 5.00 900 C \ 2.00 200 \ 1.00 300
-What was the real gross domestic product GDP) in 2013?
(Multiple Choice)
4.9/5 (43)
Explain why real gross domestic product GDP) is preferred to nominal GDP as a measure of economic growth.
(Essay)
4.7/5 (38)
Which of the following represents the largest share of U.S. gross domestic product GDP)?
(Multiple Choice)
4.8/5 (35)
Consider the following data, where gross domestic product (GDP) values are measured in millions of dollars, to answer the questions: Year Nominal GDP Real GDP GDP Deflator 2009 \ 500 100 2010 \ 551.2 106 2011 \ 600.6 \ 546 2012 \ 600.6 120
-What was the growth rate of real gross domestic product GDP) from 2011 to 2012?
(Multiple Choice)
4.8/5 (32)
Ford produces 100,000 cars this year and only sells 95,000. The 5,000 cars that are not sold_______ listed in_______ category of gross domestic product GDP).
(Multiple Choice)
4.9/5 (35)
Which of the following is included in the government purchases category of gross domestic product GDP)?
(Multiple Choice)
4.7/5 (28)
Nominal gross domestic product GDP) increased from $14.0 trillion to $14.7 trillion, and the price level increased from 120 to 126. Which of the following is true?
(Multiple Choice)
4.8/5 (39)
You bought a popular video game last year for $75 and sold it to a store this year for $20. The store sells the used game to a consumer for $50. This adds_______ to gross domestic product GDP) when the store sells the game to the consumer.
(Multiple Choice)
4.9/5 (35)
Consider the following data that identifies real gross domestic product GDP) in comparison to the long-run trend of real GDP to answer the next questions: Quarter Real GDP (billions of dollars) Long-Run Trend of Real GDP (billions of dollars) 1 4,000 4,000 2 4,160 4,120 3 4,326 4,244 4 4,413 4,371 5 4,501 4,502 6 4,591 4,637 7 4,499 4,776 8 4,409 4,919 9 4,673 5,067 10 4,954 5,219 11 5,252 5,376 12 5,376 5,537
-Between quarter 7 and quarter 8, real gross domestic product GDP) grew by what percentage?
(Multiple Choice)
4.8/5 (39)
Consider the following data that identifies real gross domestic product GDP) in comparison to the long-run trend of real GDP to answer the next questions: Quarter Real GDP (billions of dollars) Long-Run Trend of Real GDP (billions of dollars) 1 4,000 4,000 2 4,160 4,120 3 4,326 4,244 4 4,413 4,371 5 4,501 4,502 6 4,591 4,637 7 4,499 4,776 8 4,409 4,919 9 4,673 5,067 10 4,954 5,219 11 5,252 5,376 12 5,376 5,537
-Between quarter 10 and quarter 11, real gross domestic product GDP) grew by what percentage?
(Multiple Choice)
4.9/5 (35)
The government purchases category of gross domestic product GDP) includes spending by
(Multiple Choice)
4.7/5 (33)
Consider the following data that gives the quantity produced and unit price for three different goods across two different years to answer the questions. Assume that the base year is 2012. Good 2012 Price 2012 Quantity 2013 Price 2013 Quantity A \ 2.00 500 \ 2.50 600 B \ 4.00 1,000 \ 5.00 900 C \ 2.00 200 \ 1.00 300
-What was the rate of inflation between the two years?
(Multiple Choice)
4.9/5 (34)
Nominal gross domestic product GDP) is GDP measured in_______ prices.
(Multiple Choice)
4.8/5 (33)
Draw a graph to illustrate the phases of the business cycle. Be sure to identify the length of a contraction and an expansion. Identify a peak and a trough.
(Essay)
4.7/5 (43)
The difference between nominal gross domestic product GDP) and real GDP is
(Multiple Choice)
4.8/5 (33)
If nominal gross domestic product GDP) is increasing, which of the following may be true?
(Multiple Choice)
4.8/5 (46)
Filters
- Essay(0)
- Multiple Choice(0)
- Short Answer(0)
- True False(0)
- Matching(0)