Exam 20: International Finance
Exam 1: Five Foundations of Economics 170 Questions
Exam 2: Model Building and Gains From Trade173 Questions
Exam 3: The Market at Work: Supply and Demand172 Questions
Exam 4: Market Outcomes and Tax Incidence170 Questions
Exam 5: Price Controls164 Questions
Exam 6: Introduction to Macroeconomics and Gross Domestic Product167 Questions
Exam 7: Unemployment173 Questions
Exam 8: The Price Level and Inflation174 Questions
Exam 9: Savings, Interest Rates, and the Market for Loanable Funds175 Questions
Exam 10: Financial Markets and Securities169 Questions
Exam 11: Economic Growth and the Wealth of Nations174 Questions
Exam 12: Growth Theory172 Questions
Exam 13: The Aggregate Demandaggregate Supply Model175 Questions
Exam 14: The Great Recession, the Great Depression, and Great Macroeconomic Debates175 Questions
Exam 15: Federal Budgets: the Tools of Fiscal Policy175 Questions
Exam 16: Fiscal Policy169 Questions
Exam 17: Money and the Federal Reserve174 Questions
Exam 18: Monetary Policy Learning Objectives169 Questions
Exam 19: International Trade173 Questions
Exam 20: International Finance175 Questions
Select questions type
If the Central Reserve Bank of Peru the Peruvian central bank) were to take steps to devalue the sol the Peruvian currency) in foreign currency markets, the Peruvian aggregate demand curve would________ in the short run, and the Peruvian short-run aggregate supply curve would ________ in the long run.
Free
(Multiple Choice)
4.9/5  (30)
(30)
Correct Answer: Verified
D
The following graph depicts the market for potatoes in West Virginia. Assume there are similar markets for potatoes in all other U.S. states and that the potatoes sold in all states are identical. Further, assume potato sellers incur zero costs to transport potatoes between any U.S. states and that there are no other barriers to trade. Use this graph to answer the next question.
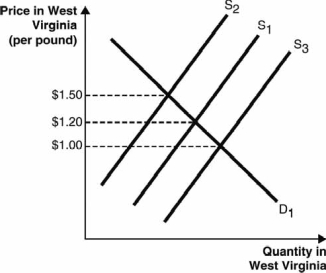 -Suppose the equilibrium price of a pound of potatoes in all U.S. states is initially $1.20. Which scenario could cause a shift in West Virginia from S1 to S2 as shown in the graph?
Free
(Multiple Choice)
4.7/5 (34)
Correct Answer:Verified
B
Traveling abroad to country B, you notice that most goods and services are substantially cheaper there than in the United States. If you know that country B's currency was recently pegged to the U.S. dollar, then you can expect
Free
(Multiple Choice)
4.8/5 (36)
Correct Answer:Verified
B
The following figure depicts the demand for Chinese yuan in the foreign currency exchange market. Use this figure to answer the next questions.
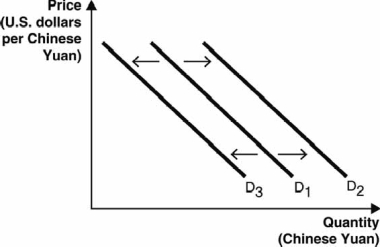 -If the interest rates in China rise relative to interest rates in the United States, the demand curve in the figure above
(Multiple Choice)
4.8/5 (25)
What is a floating exchange rate? Give an example of a country that has a floating exchange rate and explain the advantage of this policy.
(Essay)
4.9/5 (31)
The following two graphs depict the equilibrium price of a pound of grapes in California and West Virginia, respectively. Assume the type and quality of the grapes being sold in the two states are identical. Further, assume grape sellers incur zero costs to transport grapes between the two states and there are no other barriers to trade. Use these graphs to answer the next questions.
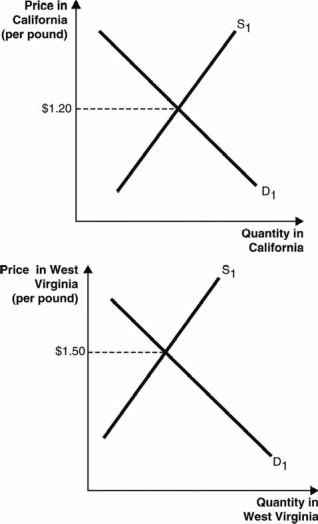 -According to the law of one price, the price of grapes will
(Multiple Choice)
4.7/5 (34)
Assume that gross domestic product GDP), investment, and government spending are constant. Under these conditions, what is the relationship between consumption and the trade balance? Explain their influence on each another.
(Essay)
4.9/5 (37)
According to the theory of purchasing power parity, why should identical goods have the same price in different locations?
(Multiple Choice)
4.8/5 (38)
If the theory of purchasing power parity holds, then how much does an Egyptian tapestry cost in the United States if the same tapestry sells for 15,000 Egyptian pounds in Egypt and the exchange rate is $0.14 per Egyptian pound?
(Multiple Choice)
4.8/5 (39)
If the Bank of Japan (the Japanese central bank) were to take steps to devalue the yen in foreign currency markets, the Japanese ________ curve would shift rightward in the short run and the Japanese ________ curve would shift leftward in the long run.
(Multiple Choice)
4.9/5 (43)
Explain the potential benefits of maintaining a capital account surplus.
(Essay)
4.9/5 (35)
The figure below depicts the three possible aggregate demand curves. 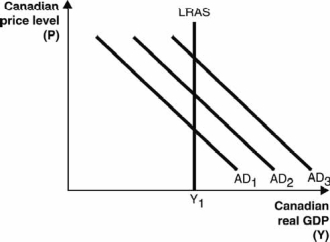 If the Bank of Canada the Canadian central bank)________ Canadian dollar(s), the Canadian dollar will depreciate and the aggregate demand curve will shift from AD2 to ________.
(Multiple Choice)
4.7/5 (31)
Define the law of one price and explain how it works in terms of supply and demand. How does the law of one price explain sustained differences between prices?
(Essay)
5.0/5 (31)
Suppose market forces outside of the control of the Chinese government are causing the price of Chinese yuan in terms of Japanese yen to rise. In order to maintain the current value of the yuan, the Chinese government must
(Multiple Choice)
4.8/5 (34)
If the United States experiences lower personal savings rates, then it must be the case that
(Multiple Choice)
4.9/5 (30)
If interest rates in Canada increase relative to the rest of the world, it means that 1) Canadian bondswill provide a ________ return than previously and (2) ________ for these bonds will ________.
(Multiple Choice)
4.7/5 (31)
The following figure depicts the demand for Japanese yen in the foreign currency exchange market. Use this figure to answer the next questions.
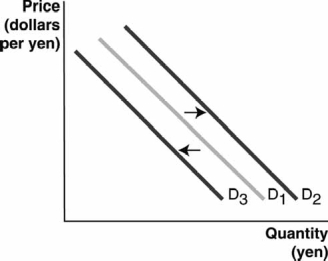 -If Japanese cars become much more popular in the United States while simultaneously Japanese interest rates fall, we can expect that the demand for yen will
(Multiple Choice)
5.0/5 (32)
Figure A below depicts the demand and supply of Japanese yen in the foreign currency exchange market. Figure B below depicts the aggregate supply-aggregate demand model for the Japanese economy. Use these figures to answer the next questions.
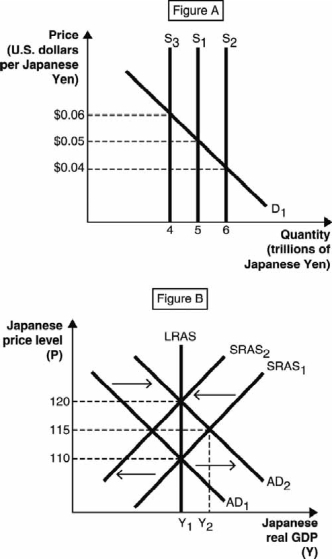 -Which of the following is the most accurate description of the phenomenon shown in Figure B?
(Multiple Choice)
4.9/5 (33)
The following figure depicts the demand for U.S. dollars in the foreign currency exchange market. Use this figure to answer the next questions.
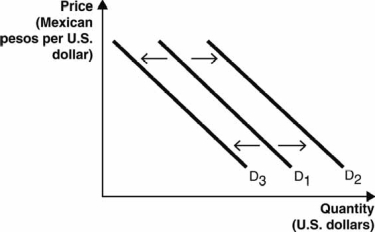 -If interest rates in Mexico rise relative to interest rates in the United States, the demand curve in the figure above
(Multiple Choice)
4.8/5 (28)
Filters
- Essay(0)
- Multiple Choice(0)
- Short Answer(0)
- True False(0)
- Matching(0)