Exam 6: Statistical Inference
Exam 1: Introduction49 Questions
Exam 2: Descriptive Statistics84 Questions
Exam 3: Data Visualization69 Questions
Exam 4: Descriptive Data Mining56 Questions
Exam 5: Probability: an Introduction to Modeling Uncertainty62 Questions
Exam 6: Statistical Inference62 Questions
Exam 7: Linear Regression71 Questions
Exam 8: Time Series Analysis and Forecasting58 Questions
Exam 9: Predictive Data Mining40 Questions
Exam 10: Spreadsheet Models64 Questions
Exam 11: Linear Optimization Models58 Questions
Exam 12: Integer Linear Optimization Models56 Questions
Exam 13: Nonlinear Optimization Models55 Questions
Exam 14: Monte Carlo Simulation59 Questions
Exam 15: Decision Analysis58 Questions
Select questions type
In interval estimation, as the sample size becomes larger, the interval estimate
(Multiple Choice)
4.7/5  (34)
(34)
In a random sample of 400 registered voters, 120 indicated they plan to vote for Trump for President. Determine a 95% confidence interval for the proportion of all the registered voters who will vote for Trump.
(Multiple Choice)
4.9/5 (33)
The CEO of a company wants to estimate the percent of employees that use company computers to go on Facebook during work hours with 95% confidence. He selects a random sample of 150 of the employees and finds that 53 of them logged onto Facebook that day. What is the point estimate of the proportion of the population that logged onto Facebook that day?
(Multiple Choice)
5.0/5 (29)
A statistics teacher started class one day by drawing the names of 10 students out of a hat and asked them to do as many pushups as they could. The 10 randomly selected students averaged 15 pushups per person with a standard deviation of 9 pushups.Suppose the distribution of the population of number of pushups that can be done is approximately normal. The 95% confidence interval for the true mean number of pushups that can be done is
(Multiple Choice)
5.0/5 (41)
A pizza shop advertises that they deliver in 30 minutes or less or it is free. People who live in homes that are located on the opposite side of town believe it will take the pizza shop longer than 30 minutes to make and deliver the pizza. Write the null and alternative hypotheses that can be used to conduct a significance test.
(Multiple Choice)
4.8/5 (44)
A pizza shop advertises that they deliver in 30 minutes or less or it is free. People who live in homes that are located on the opposite side of town believe it will take the pizza shop longer than 30 minutes to make and deliver the pizza. A random sample of 50 deliveries to homes across town was taken and the mean time was computed to be 32 minutes. What is the appropriate symbol to represent the value, 32?
(Multiple Choice)
4.8/5 (38)
The CEO of a company wants to estimate the percent of employees that use company computers to go on Facebook during work hours with 95% confidence.He selects a random sample of 150 of the employees and finds that 53 of them logged onto Facebook that day.Compute the 95% confidence interval for the population proportion.
(Multiple Choice)
4.8/5 (46)
The purpose of statistical inference is to make estimates or draw conclusions about a
(Multiple Choice)
4.8/5 (39)
Larger values of have the disadvantage of increasing the probability of making a
(Multiple Choice)
4.9/5 (43)
A parameter is a numerical measure from a population, such as ?
(Multiple Choice)
4.7/5 (30)
In order to determine an interval for the mean of a population with unknown standard deviation a sample of 24 items is selected. The mean of the sample is determined to be 23. The number of degrees of freedom for reading the t value is
(Multiple Choice)
4.9/5 (29)
A null and alternative hypothesis for a one proportion z test are given as H0: p = 0.8, Ha: p < 0.8. This hypothesis test is
(Multiple Choice)
4.8/5 (37)
A simple random sample of 100 observations was taken from a large population. The sample mean and the standard deviation were determined to be 80 and 12 respectively. Calculate the standard error of the mean.
(Short Answer)
4.9/5 (42)
A cellular phone company claims that the mean amount spent per month is more than $75. A test is made of Ho: μ = 75 versus Ha: μ > 75. The null hypothesis is rejected. State the appropriate conclusion.
(Essay)
4.7/5 (36)
As the number of degrees of freedom for a t distribution increases, the difference between the t distribution and the standard normal distribution
(Multiple Choice)
4.9/5 (47)
What are the two decisions that you can make from performing a hypothesis test?
(Multiple Choice)
4.8/5 (36)
The random numbers generated using Excels RAND function follows a ________________ probability distribution between 0 and 1.
(Multiple Choice)
4.8/5 (47)
A large manufacturing plant has analyzed the amount of time required to produce an electrical part and determined that the times follow a normal distribution with mean time ? = 45 hours. The production manager has developed a new procedure for producing the part. He believes that the new procedure will decrease the population mean amount of time required to produce the part. After training a group of production line workers, a random sample of 25 parts will be selected and the average amount of time required to produce them will be determined. If the switch is made to the new procedure, the cost to implement the new procedure will be more than offset by the savings in manpower required to produce the parts. Use the hypotheses: Ho: ? ? .45 hours and Ha: ? < 45 hours. If the sample mean amount of time is = 43.118 hours with the sample standard deviation s = 5.5 hours, give the appropriate conclusion, for ? = 0.025. ?
(Multiple Choice)
4.8/5 (39)
The population parameter value and the point estimate differ because a sample is not a census of the entire population, but it is being used to develop the 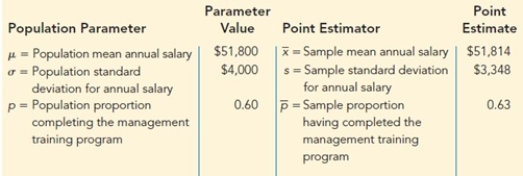
(Multiple Choice)
4.7/5 (41)
Filters
- Essay(0)
- Multiple Choice(0)
- Short Answer(0)
- True False(0)
- Matching(0)