Exam 7: Linear Regression
Exam 1: Introduction49 Questions
Exam 2: Descriptive Statistics84 Questions
Exam 3: Data Visualization69 Questions
Exam 4: Descriptive Data Mining56 Questions
Exam 5: Probability: an Introduction to Modeling Uncertainty62 Questions
Exam 6: Statistical Inference62 Questions
Exam 7: Linear Regression71 Questions
Exam 8: Time Series Analysis and Forecasting58 Questions
Exam 9: Predictive Data Mining40 Questions
Exam 10: Spreadsheet Models64 Questions
Exam 11: Linear Optimization Models58 Questions
Exam 12: Integer Linear Optimization Models56 Questions
Exam 13: Nonlinear Optimization Models55 Questions
Exam 14: Monte Carlo Simulation59 Questions
Exam 15: Decision Analysis58 Questions
Select questions type
_____________ refers to the data set used to compare model forecasts and ultimately pick a model for predicting values of the dependent variable.
Free
(Multiple Choice)
4.8/5  (39)
(39)
Correct Answer: Verified
C
The ____________________ is a measure of the error that results from using the estimated regression equation to preduct the values of the dependent variable in the sample
Free
(Multiple Choice)
5.0/5 (33)
Correct Answer:Verified
C
The prespecified value of the independent variable at which its relationship with the dependent variable changes in a piecewise linear regression model is referred to as the
Free
(Multiple Choice)
4.9/5 (36)
Correct Answer:Verified
B
Assessing the regression model on data other than the sample data that was used to generate the model is known as
(Multiple Choice)
4.9/5 (46)
The multiple regression model represents pricing for residential housing in a certain market. Predicted Price ̂ = 19,856.56 + 6,985.25 bedrooms + 87.53 square foot. A house in the local market has 4 bedrooms and 2,200 square feet of living area. Use the multiple regression model to determine the predicted price.
(Short Answer)
4.7/5 (26)
The scatter chart below displays the residuals verses the dependent variable, x. Which of the following conclusions can be drawn based upon this scatter chart? 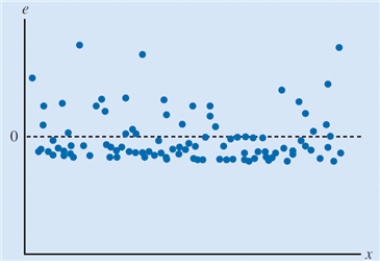
(Multiple Choice)
4.8/5 (40)
The multiple regression model represents pricing for residential housing in a certain market. Predicted Price = 19,856.56 + 6985.25 bedrooms + 87.53 square foot. A house in the local market has 4 bedrooms and 2500 square feet of living area. Use the multiple regression model to determine the predicted price.
(Short Answer)
4.8/5 (33)
A procedure for using sample data to find the estimated regression equation is
(Multiple Choice)
4.9/5 (35)
The degree of correlation among independent variables in a regression model is called
(Multiple Choice)
4.9/5 (37)
__________________ refers to the use of sample data to calculate a range of values that is believed to include the value of the population parameter.
(Multiple Choice)
4.9/5 (32)
Consider the below data which is based on a company's sales in the period 2000 to 2011 along with the national income of the country, where the business is set up. Year National Income (in millions of dollars) Company's sales (in thousands of dollars) 2000 305 470 2001 316 485 2002 358 499 2003 350 515 2004 375 532 2005 392 532 2006 400 556 2007 398 576 2008 430 583 2009 456 587 2010 578 601 2011 498 605
a. Develop a scatter chart for these data, treating the national income as the independent variable. Does a simple linear regression model appear to be appropriate?
b. Develop an appropriate estimated regression equation to predict the company's sales, given the national income. How much variation in the sample values of company's sales is explained by this regression model
(Essay)
4.7/5 (29)
The _____________ is an indication of how frequently interval estimates based on samples of the same size taken from the same population using identical sampling techniques will contain the true value of the parameter we are estimating.
(Multiple Choice)
4.9/5 (46)
A student is interested in studying the impact of number of books referred by students on a statistics course and the number of lectures they attended on the final grade on the course. A sample of 25 students is selected and the data is given below. BOOKS AT TEND GRADE 2 17 60 3 18 54 1 17 62 5 20 59 2 12 44 1 13 40 3 17 96 4 19 90 5 22 97 2 22 54 5 22 91 1 12 48 3 18 91 1 12 65 4 21 82 5 14 61 3 18 54 3 13 46 1 8 64 5 22 90
a. Develop an estimated regression equation using number of books referred and the number of lectures attended to predict the final grade on the course.
b. Joseph referred 4 books and attended 19 lectures. What is his predicted final score on the course?
(Essay)
4.8/5 (34)
The data listed below is the average personal income and personal consumption expenditures based on the survey
conducted in the year 1995 to 2009 in U.S. Personal income Personal consumption expenditures (\ ) 23,310 18,714 24,444 19,569 25,657 20,414 27,260 21,434 28,336 22,738 30,317 24,227 31,162 25,074 31,448 25,865 32,282 26,848 33,872 28,228 35,423 29,818 37,723 31,210 39,418 32,551 40,156 33,273 39,113 32,853
a. What is the 95 percent confidence interval for the regression parameter β1? Based on this interval, what
conclusion can you make about the hypotheses that the regression parameter β1 is equal to zero?
d. What is the 95 percent confidence interval for the regression parameter β0? Based on this interval, what
conclusion can you make about the hypotheses that the regression parameter β0 is equal to zero?
(Essay)
4.7/5 (27)
A survey is conducted to determine whether the age of car influences the annual maintenance cost. A sample of 10 cars is selected and the data is shown below.
a. Test whether each of the regression parameters β0 and β1 is equal to zero at a 0.05 level of significance.
b. Interpret the estimated regression parameters? Are these interpretations reasonable?
(Essay)
4.9/5 (41)
_____ is a statistical procedure used to develop an equation showing how two variables are related.
(Multiple Choice)
4.8/5 (37)
A survey is conducted to determine whether the age of car influences the annual maintenance cost. A sample of 10
cars is selected and the data is shown below.
a. Develop a scatter chart for these data with age of cars as the independent variable. What does the scatter chart
indicate about the relationship between age of a car and the annual maintenance cost?
b. Use the data to develop an estimated regression equation that could be used to predict the annual maintenance
cost given the age of the car. What is the estimated regression model?
(Essay)
4.9/5 (21)
Filters
- Essay(0)
- Multiple Choice(0)
- Short Answer(0)
- True False(0)
- Matching(0)