Exam 16: Time-Series Forecasting
Exam 1: Defining and Collecting Data204 Questions
Exam 2: Organizing and Visualizing Variables185 Questions
Exam 3: Numerical Descriptive Measures167 Questions
Exam 4: Basic Probability163 Questions
Exam 5: Discrete Probability Distributions216 Questions
Exam 6: The Normal Distribution and Other Continuous Distributions187 Questions
Exam 7: Sampling Distributions129 Questions
Exam 8: Confidence Interval Estimation189 Questions
Exam 9: Fundamentals of Hypothesis Testing: One-Sample Tests185 Questions
Exam 10: Two-Sample Tests212 Questions
Exam 11: Analysis of Variance210 Questions
Exam 12: Chi-Square and Nonparametric Tests175 Questions
Exam 13: Simple Linear Regression210 Questions
Exam 14: Introduction to Multiple Regression256 Questions
Exam 15: Multiple Regression Model Building67 Questions
Exam 16: Time-Series Forecasting168 Questions
Exam 17: Business Analytics113 Questions
Exam 18: A Roadmap for Analyzing Data325 Questions
Exam 19: Statistical Applications in Quality Management158 Questions
Exam 20: Decision Making123 Questions
Exam 21: Getting Started: Important Things to Learn First35 Questions
Exam 22: Binomial Distribution and Normal Approximation230 Questions
Select questions type
Which of the following terms describes the overall long-term tendency of a time series?
(Multiple Choice)
5.0/5  (44)
(44)
SCENARIO 16-13
Given below is the monthly time series data for U.S.retail sales of building materials over a specific year.
 The results of the linear trend,quadratic trend,exponential trend,first-order autoregressive,second-order autoregressive and third-order autoregressive model are presented below in which the coded month for the 1st month is 0:
Linear trend model:
The results of the linear trend,quadratic trend,exponential trend,first-order autoregressive,second-order autoregressive and third-order autoregressive model are presented below in which the coded month for the 1st month is 0:
Linear trend model:
 Quadratic trend model:


 Third-order autoregressive::
 Below is the residual plot of the various models:
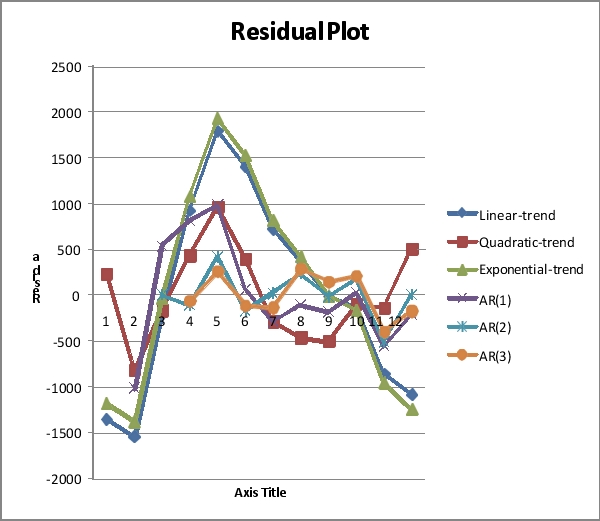 -Referring to Scenario 16-13,you can conclude that the third-order autoregressive model is appropriate at the 5% level of significance.
(True/False)
4.9/5 (42)
SCENARIO 16-13
Given below is the monthly time series data for U.S.retail sales of building materials over a specific year.
The results of the linear trend,quadratic trend,exponential trend,first-order autoregressive,second-order autoregressive and third-order autoregressive model are presented below in which the coded month for the 1st month is 0:
Linear trend model:
Quadratic trend model:
Third-order autoregressive::
Below is the residual plot of the various models:
-Referring to Scenario 16-13,the best model based on the residual plots is the second-order autoregressive model.
(True/False)
4.8/5 (33)
Given a data set with 15 yearly observations,there are only thirteen 3-year moving averages.
(True/False)
4.9/5 (36)
A trend is a persistent pattern in annual time-series data that has to be followed for several years.
(True/False)
4.9/5 (45)
SCENARIO 16-10
Business closures in a city in the western U.S.from 2007 to 2012 were:
 Microsoft Excel was used to fit both first-order and second-order autoregressive models,resulting in the following partial outputs:
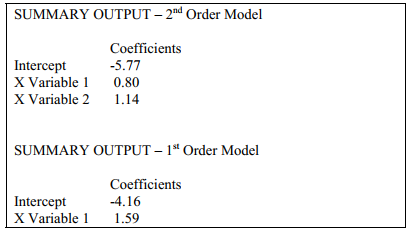 -Referring to Scenario 16-10,the fitted values for the second-order autoregressive model are _____,_____,_____,and _____ .
(Short Answer)
4.7/5 (32)
SCENARIO 16-13
Given below is the monthly time series data for U.S.retail sales of building materials over a specific year.
The results of the linear trend,quadratic trend,exponential trend,first-order autoregressive,second-order autoregressive and third-order autoregressive model are presented below in which the coded month for the 1st month is 0:
Linear trend model:
Quadratic trend model:
Third-order autoregressive::
Below is the residual plot of the various models:
-Referring to Scenario 16-13,what is the value of the t test statistic for testing the appropriateness of the third-order autoregressive model?
(Short Answer)
4.7/5 (35)
SCENARIO 16-13
Given below is the monthly time series data for U.S.retail sales of building materials over a specific year.
The results of the linear trend,quadratic trend,exponential trend,first-order autoregressive,second-order autoregressive and third-order autoregressive model are presented below in which the coded month for the 1st month is 0:
Linear trend model:
Quadratic trend model:
Third-order autoregressive::
Below is the residual plot of the various models:
-Referring to Scenario 16-13,what is the exponentially smoothed value for the second month using a smoothing coefficient of W = 0.5?
(Short Answer)
4.9/5 (43)
SCENARIO 16-13
Given below is the monthly time series data for U.S.retail sales of building materials over a specific year.
The results of the linear trend,quadratic trend,exponential trend,first-order autoregressive,second-order autoregressive and third-order autoregressive model are presented below in which the coded month for the 1st month is 0:
Linear trend model:
Quadratic trend model:
Third-order autoregressive::
Below is the residual plot of the various models:
-Referring to Scenario 16-13,you can reject the null hypothesis for testing the appropriateness of the third-order autoregressive model at the 5% level of significance.
(True/False)
4.9/5 (41)
SCENARIO 16-5
The number of passengers arriving at San Francisco on the Amtrak cross-country express on 6 successive Mondays were: 60,72,96,84,36,and 48.
-Referring to Scenario 16-5,the number of arrivals will be smoothed with a 3-term moving average.There will be a total of _____ smoothed values.
(Short Answer)
4.8/5 (35)
SCENARIO 16-14
A contractor developed a multiplicative time-series model to forecast the number of contracts in future quarters,using quarterly data on number of contracts during the 3-year period from 2011 to 2013.The following is the resulting regression equation:
ln Yˆ = 3.37 + 0.117 X - 0.083 Q1 + 1.28 Q2 + 0.617 Q3
where
Yˆ is the estimated number of contracts in a quarter.
X is the coded quarterly value with X = 0 in the first quarter of 2011.
Q1 is a dummy variable equal to 1 in the first quarter of a year and 0 otherwise.
Q2 is a dummy variable equal to 1 in the second quarter of a year and 0 otherwise.
Q3 is a dummy variable equal to 1 in the third quarter of a year and 0 otherwise.
-Referring to Scenario 16-14,the best interpretation of the coefficient of Q3 (0.617)in the regression equation is:
(Multiple Choice)
4.9/5 (33)
The method of least squares is used on time-series data for
(Multiple Choice)
4.7/5 (39)
SCENARIO 16-13
Given below is the monthly time series data for U.S.retail sales of building materials over a specific year.
The results of the linear trend,quadratic trend,exponential trend,first-order autoregressive,second-order autoregressive and third-order autoregressive model are presented below in which the coded month for the 1st month is 0:
Linear trend model:
Quadratic trend model:
Third-order autoregressive::
Below is the residual plot of the various models:
-Referring to Scenario 16-13,what is your estimated annual compound growth rate using the exponential-trend model?
(Short Answer)
4.7/5 (40)
SCENARIO 16-13
Given below is the monthly time series data for U.S.retail sales of building materials over a specific year.
The results of the linear trend,quadratic trend,exponential trend,first-order autoregressive,second-order autoregressive and third-order autoregressive model are presented below in which the coded month for the 1st month is 0:
Linear trend model:
Quadratic trend model:
Third-order autoregressive::
Below is the residual plot of the various models:
-Referring to Scenario 16-13,what is the exponentially smoothed forecast for the 13th month using a smoothing coefficient of W = 0.25 if the exponentially smooth value for the 10th and 11th month are 9,477.7776 and 9,411.8332,respectively?
(Short Answer)
4.8/5 (41)
The annual multiplicative time-series model does not possess _____ component.
(Multiple Choice)
4.9/5 (44)
Which of the following methods should not be used for short-term forecasts into the future?
(Multiple Choice)
4.7/5 (35)
SCENARIO 16-4
The number of cases of merlot wine sold by a Paso Robles winery in an 8-year period follows. 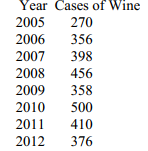 -Referring to Scenario 16-4,exponential smoothing with a weight or smoothing constant of
0.4 will be used to forecast wine sales.The forecast for 2013 is .
-Referring to Scenario 16-4,exponential smoothing with a weight or smoothing constant of
0.4 will be used to forecast wine sales.The forecast for 2013 is .
(Short Answer)
4.8/5 (34)
For time intervals exceeding one year and are not explainable using trend or cyclical analyses,which of the following statement(s)are the most likely explanation(s)?
(Multiple Choice)
4.8/5 (30)
SCENARIO 16-4
The number of cases of merlot wine sold by a Paso Robles winery in an 8-year period follows.
-Referring to Scenario 16-4,exponential smoothing with a weight or smoothing constant of
0.2 will be used to smooth the wine sales.The value of E4,the smoothed value for 2008 is
.
(Short Answer)
4.8/5 (36)
SCENARIO 16-13
Given below is the monthly time series data for U.S.retail sales of building materials over a specific year.
The results of the linear trend,quadratic trend,exponential trend,first-order autoregressive,second-order autoregressive and third-order autoregressive model are presented below in which the coded month for the 1st month is 0:
Linear trend model:
Quadratic trend model:
Third-order autoregressive::
Below is the residual plot of the various models:
-Referring to Scenario 16-13,you can conclude that the second-order autoregressive model is appropriate at the 5% level of significance.
(True/False)
4.9/5 (34)
Filters
- Essay(0)
- Multiple Choice(0)
- Short Answer(0)
- True False(0)
- Matching(0)