Exam 16: Time-Series Forecasting
Exam 1: Defining and Collecting Data204 Questions
Exam 2: Organizing and Visualizing Variables185 Questions
Exam 3: Numerical Descriptive Measures167 Questions
Exam 4: Basic Probability163 Questions
Exam 5: Discrete Probability Distributions216 Questions
Exam 6: The Normal Distribution and Other Continuous Distributions187 Questions
Exam 7: Sampling Distributions129 Questions
Exam 8: Confidence Interval Estimation189 Questions
Exam 9: Fundamentals of Hypothesis Testing: One-Sample Tests185 Questions
Exam 10: Two-Sample Tests212 Questions
Exam 11: Analysis of Variance210 Questions
Exam 12: Chi-Square and Nonparametric Tests175 Questions
Exam 13: Simple Linear Regression210 Questions
Exam 14: Introduction to Multiple Regression256 Questions
Exam 15: Multiple Regression Model Building67 Questions
Exam 16: Time-Series Forecasting168 Questions
Exam 17: Business Analytics113 Questions
Exam 18: A Roadmap for Analyzing Data325 Questions
Exam 19: Statistical Applications in Quality Management158 Questions
Exam 20: Decision Making123 Questions
Exam 21: Getting Started: Important Things to Learn First35 Questions
Exam 22: Binomial Distribution and Normal Approximation230 Questions
Select questions type
SCENARIO 16-14
A contractor developed a multiplicative time-series model to forecast the number of contracts in future quarters,using quarterly data on number of contracts during the 3-year period from 2011 to 2013.The following is the resulting regression equation:
ln Yˆ = 3.37 + 0.117 X - 0.083 Q1 + 1.28 Q2 + 0.617 Q3
where
Yˆ is the estimated number of contracts in a quarter.
X is the coded quarterly value with X = 0 in the first quarter of 2011.
Q1 is a dummy variable equal to 1 in the first quarter of a year and 0 otherwise.
Q2 is a dummy variable equal to 1 in the second quarter of a year and 0 otherwise.
Q3 is a dummy variable equal to 1 in the third quarter of a year and 0 otherwise.
-Referring to Scenario 16-14,to obtain a forecast for the fourth quarter of 2014 using the model,which of the following sets of values should be used in the regression equation?
(Multiple Choice)
4.9/5  (49)
(49)
You need to decide whether you should invest in a particular stock.You would like to invest if the price is likely to rise in the long run.You have data on the daily mean price of this stock over the past 12 months.Your best action is to
(Multiple Choice)
4.9/5 (26)
SCENARIO 16-4
The number of cases of merlot wine sold by a Paso Robles winery in an 8-year period follows. 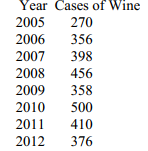 -Referring to Scenario 16-3,suppose the last two smoothed values are 81 and 96 (Note: they are not).What would you forecast as the value of the time series for July?
(Multiple Choice)
4.7/5 (30)
SCENARIO 16-2
The monthly advertising expenditures of a department store chain (in $1,000,000s)were collected over the last decade.The last 14 months of this time series follows:
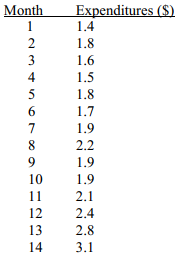 -Referring to Scenario 16-2,set up a scatter plot (i.e. ,time-series plot)with months on the horizontal X-axis.
(Essay)
4.8/5 (29)
SCENARIO 16-4
The number of cases of merlot wine sold by a Paso Robles winery in an 8-year period follows.
-Referring to Scenario 16-3,if a three-month moving average is used to smooth this series,how many forecasts would the analysis have?
(Multiple Choice)
4.9/5 (42)
SCENARIO 16-12
A local store developed a multiplicative time-series model to forecast its revenues in future quarters,using quarterly data on its revenues during the 5-year period from 2009 to 2013.The following is the resulting regression equation:
log10 Yˆ = 6.102 + 0.012 X - 0.129 Q1 - 0.054 Q2 + 0.098 Q3
where
Yˆ is the estimated number of contracts in a quarter.
X is the coded quarterly value with X = 0 in the first quarter of 2008.
Q1 is a dummy variable equal to 1 in the first quarter of a year and 0 otherwise.
Q2 is a dummy variable equal to 1 in the second quarter of a year and 0 otherwise.
Q3 is a dummy variable equal to 1 in the third quarter of a year and 0 otherwise.
Time-Series Forecasting 16-31
-Referring to Scenario 16-12,in testing the significance of the coefficient for Q1 in the regression equation (- 0.129)which has a p-value of 0.492.Which of the following is the best interpretation of this result?
(Multiple Choice)
4.7/5 (41)
SCENARIO 16-13
Given below is the monthly time series data for U.S.retail sales of building materials over a specific year.
 The results of the linear trend,quadratic trend,exponential trend,first-order autoregressive,second-order autoregressive and third-order autoregressive model are presented below in which the coded month for the 1st month is 0:
Linear trend model:
The results of the linear trend,quadratic trend,exponential trend,first-order autoregressive,second-order autoregressive and third-order autoregressive model are presented below in which the coded month for the 1st month is 0:
Linear trend model:
 Quadratic trend model:


 Third-order autoregressive::
 Below is the residual plot of the various models:
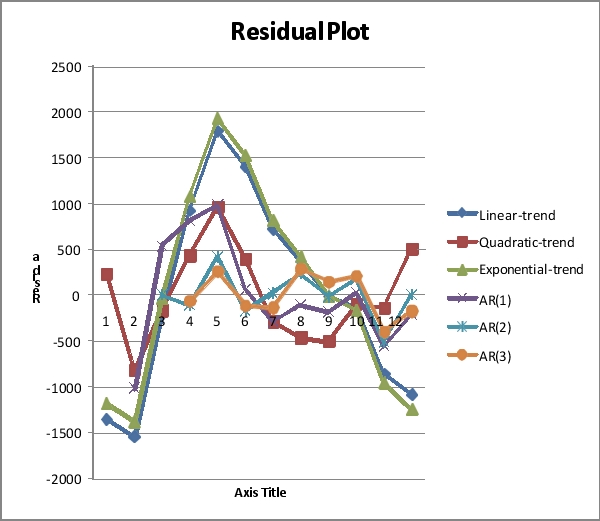 -Referring to Scenario 16-13,what is your forecast for the 13th month using the linear-trend model?
(Short Answer)
4.8/5 (48)
Filters
- Essay(0)
- Multiple Choice(0)
- Short Answer(0)
- True False(0)
- Matching(0)