Exam 5: Decision Support Tools
Exam 1: Identifying and Defining Problems46 Questions
Exam 2: Solving the Problem46 Questions
Exam 3: Thinking Critically46 Questions
Exam 4: Group Decision Making and Problem Solving46 Questions
Exam 5: Decision Support Tools46 Questions
Select questions type
The ____________________ value of a set of data is that point that separates the higher values from the lower values.
(Short Answer)
4.8/5  (33)
(33)
MODIFIED TRUE/FALSE
-The mean of a set of data is the value that occurs most frequently._________________________
(True/False)
4.9/5 (37)
Please identify the letter of the choice that best matches the term below.
Correct Answer: Verified
Premises:
Responses:
(Matching)
4.9/5 (29)
Like OpenOffice Calc, ____ is a free, open-source spreadsheet program that is part of the GNOME desktop for computers running the Linux operating system.
(Multiple Choice)
4.9/5 (29)
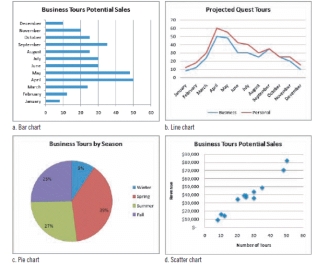 -Referring to the figure above, to show directions or trends in a linear data series over time you would use the ____ chart.
(Multiple Choice)
4.8/5 (43)
When modeling a decision using ____ data, you can use mathematics to help you analyze and compare the data.
(Multiple Choice)
5.0/5 (39)
The mode is the most common descriptive statistic and is simple to compute.
(True/False)
4.7/5 (26)
MODIFIED TRUE/FALSE
-Standard deviation is a measure of the variability of a set of data._________________________
(True/False)
4.9/5 (30)
The ____________________ are values in the results that could change if the decision variables change.
(Short Answer)
4.9/5 (32)
Decision variables are values that could change and affect the results.Statisticians refer to these as ____ variables.
(Multiple Choice)
4.9/5 (44)
When normalizing, you usually ____ the data by a variable so you can compare the variables fairly.
(Multiple Choice)
4.9/5 (27)
MODIFIED TRUE/FALSE
-A cell reference is a pointer that you include in a formula to tell the spreadsheet where to find the actual data._________________________
(True/False)
4.8/5 (27)
Decision variables are often used in formulas that show results.
(True/False)
4.8/5 (34)
-Referring to the figure above, if you wanted to compare the percentage of an element to the whole, you would use the ____ chart.
(Multiple Choice)
4.9/5 (37)
MODIFIED TRUE/FALSE
-A DSS is ideal for analyzing complex problems that involve sets of data and demand a systematic decision-making approach._________________________
(True/False)
4.9/5 (21)
A decision tree is a support tool that models decisions using a treelike diagram.Each branch of the tree represents an option and its ____.
(Multiple Choice)
4.9/5 (29)
Although means are affected by extremely large or small values in the data set, ____ are not.
(Multiple Choice)
4.7/5 (25)
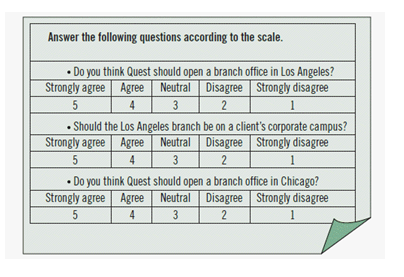 -The survey shown above takes subjective data and turns it into a quantitative model by converting the information into numbers.
(True/False)
4.8/5 (21)
MODIFIED TRUE/FALSE
-Variables are elements that are not likely to change much over time._________________________
(True/False)
4.9/5 (37)
Helen has researched some software and found one that completes 3D scatter plots.It turns out that most software tools can display 3D scatter plots with up to ____ dimensions.
(Multiple Choice)
4.8/5 (27)
Filters
- Essay(0)
- Multiple Choice(0)
- Short Answer(0)
- True False(0)
- Matching(0)