Exam 25: Analysis of Experiments and Observational Studies
Exam 1: Data and Decisions29 Questions
Exam 2: Visualizing and Describing Categorical Data30 Questions
Exam 3: Describing, Displaying, and Visualizing Quantitative Data16 Questions
Exam 4: Correlation and Linear Regression21 Questions
Exam 5: Randomness and Probability22 Questions
Exam 6: Random Variables and Probability Models20 Questions
Exam 7: The Normal and Other Continuous Distributions20 Questions
Exam 8: Data Sources: Observational Studies and Surveys23 Questions
Exam 9: Data Sources: Experiments12 Questions
Exam 10: Sampling Distributions and Confidence Intervals for Proportio18 Questions
Exam 11: Confidence Intervals for Means20 Questions
Exam 12: Testing Hypotheses21 Questions
Exam 13: More About Tests and Intervals16 Questions
Exam 14: Comparing Two Means13 Questions
Exam 15: Inference for Counts: Chi-Square Tests17 Questions
Exam 16: Inference for Regression19 Questions
Exam 17: Understanding Residuals19 Questions
Exam 18: Multiple Regression18 Questions
Exam 19: Building Multiple Regression Models16 Questions
Exam 20: Time Series Analysis18 Questions
Exam 21: Introduction to Data Mining11 Questions
Exam 22: Quality Control20 Questions
Exam 23: Nonparametric Methods13 Questions
Exam 24: Decision Making and Risk19 Questions
Exam 25: Analysis of Experiments and Observational Studies9 Questions
Exam 26: Statistics and Data Analysis207 Questions
Select questions type
The plot of ANOVA residuals shown below indicates that the ________________________ .

Free
(Multiple Choice)
4.8/5  (29)
(29)
Correct Answer: Verified
A
Quality control engineers fire tiles made with this new material at three different temperature settings (1500ºF, 1800ºF and 2200ºF) and for four different times (2 hours, 6 hours, 10 hours and 12 hours) to determine the optimal parameter settings for firing that will result in tiles with high flexural strength.The response variable in this experiment is ________________________ .
Free
(Multiple Choice)
4.8/5 (38)
Correct Answer:Verified
A
An advocacy group is interested in determining if gender (1 = Female, 2 = Male) affects executive level salaries in three different industries: (1 = Consumer Goods,
2 = Financial, 3 = Health Care).The number of treatments in this example is ________________________ .
Free
(Multiple Choice)
4.8/5 (40)
Correct Answer:Verified
D
Quality control engineers fire tiles made with a new material at three different temperature settings (1500ºF, 1800ºF and 2200ºF) and for four different times (2 hours, 6 hours, 10 hours and 12 hours) to determine the optimal parameter settings for firing that will result in tiles with high flexural strength.The number of treatments in this experiment is ________________________ .
(Multiple Choice)
4.7/5 (38)
Based on the partial ANOVA results shown below, the F statistic value is ________________________ .
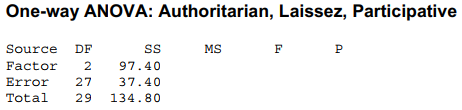
(Multiple Choice)
5.0/5 (40)
A health food company is examining three different blanching processes to determine which is best in terms of vitamin A retention (mg/100mg) for dark green vegetable material.The response variable is ________________________ .
(Multiple Choice)
5.0/5 (36)
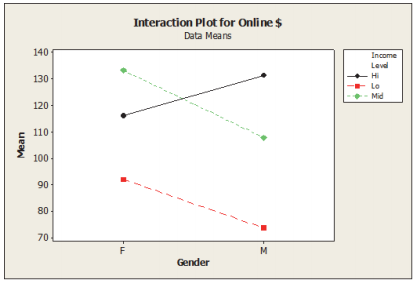
Data obtained from a survey of online customers were analyzed to see if gender and income level influence the amount consumers spend online for holiday shopping.The interaction plot shown below suggests that ________________________
(Multiple Choice)
4.8/5 (30)
In ANOVA, the Bonferroni method is used to ________________________ .
(Multiple Choice)
4.8/5 (36)
Based on the partial ANOVA results shown below, the F statistic value is ________________________ .
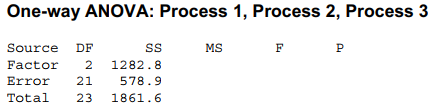
(Multiple Choice)
5.0/5 (41)
Filters
- Essay(0)
- Multiple Choice(0)
- Short Answer(0)
- True False(0)
- Matching(0)