Exam 20: Time Series Analysis
Exam 1: Data and Decisions29 Questions
Exam 2: Visualizing and Describing Categorical Data30 Questions
Exam 3: Describing, Displaying, and Visualizing Quantitative Data16 Questions
Exam 4: Correlation and Linear Regression21 Questions
Exam 5: Randomness and Probability22 Questions
Exam 6: Random Variables and Probability Models20 Questions
Exam 7: The Normal and Other Continuous Distributions20 Questions
Exam 8: Data Sources: Observational Studies and Surveys23 Questions
Exam 9: Data Sources: Experiments12 Questions
Exam 10: Sampling Distributions and Confidence Intervals for Proportio18 Questions
Exam 11: Confidence Intervals for Means20 Questions
Exam 12: Testing Hypotheses21 Questions
Exam 13: More About Tests and Intervals16 Questions
Exam 14: Comparing Two Means13 Questions
Exam 15: Inference for Counts: Chi-Square Tests17 Questions
Exam 16: Inference for Regression19 Questions
Exam 17: Understanding Residuals19 Questions
Exam 18: Multiple Regression18 Questions
Exam 19: Building Multiple Regression Models16 Questions
Exam 20: Time Series Analysis18 Questions
Exam 21: Introduction to Data Mining11 Questions
Exam 22: Quality Control20 Questions
Exam 23: Nonparametric Methods13 Questions
Exam 24: Decision Making and Risk19 Questions
Exam 25: Analysis of Experiments and Observational Studies9 Questions
Exam 26: Statistics and Data Analysis207 Questions
Select questions type
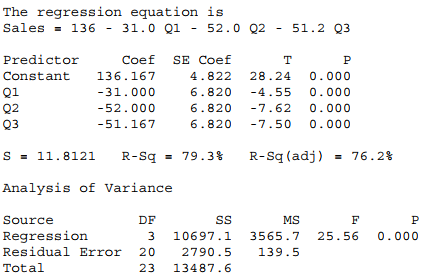
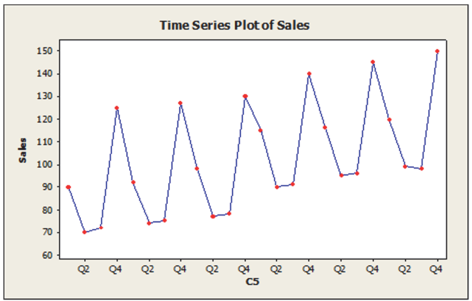
A seasonal regression model was fit to quarterly sales data (in $10,000) for a small company specializing in green cleaning products.The results are shown below.The regression coefficients in the seasonal regression model indicate that sales are on average ________________________ .
Free
(Multiple Choice)
4.8/5  (40)
(40)
Correct Answer: Verified
A
A seasonal regression model was fit to quarterly sales data (in $10,000) for a small company specializing in green cleaning products.The results are shown below.What is the forecast (in $10,000) for the second quarter of the next year?
Free
(Multiple Choice)
5.0/5 (30)
Correct Answer:Verified
B
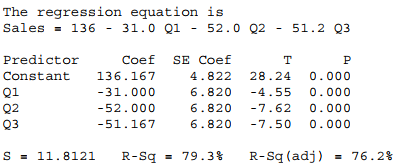
Suppose that the single exponential smoothing (SES) model was applied to data measuring demand for a particular part needed by customer with results as shown below.The likely value used for α is ________________________
Free
(Multiple Choice)
4.9/5 (26)
Correct Answer:Verified
E
The table below shows the actual closing daily stock prices for Kyocera Corporation for September 2 through September 4, 2008.What is the 2-day moving average forecast for September 5?

(Multiple Choice)
4.8/5 (36)
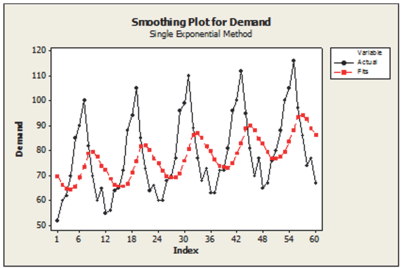
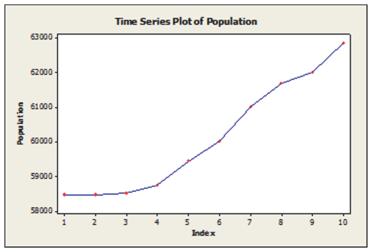
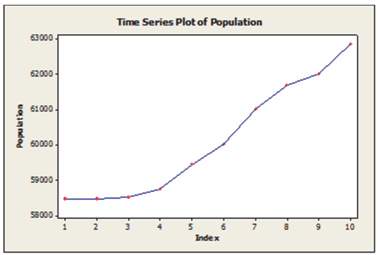
Annual estimates of the population in the age group 65 + in Alameda County, California from 1999 (t = 1) onward are shown in the time series graph below.The dominant component in the time series is ________________________
(Multiple Choice)
4.9/5 (43)
Annual estimates of the population in Kauai County, Hawaii from 1999 (t = 1) onward are shown in the time series graph below.The dominant component in this time series is ________________________ .
(Multiple Choice)
4.9/5 (38)
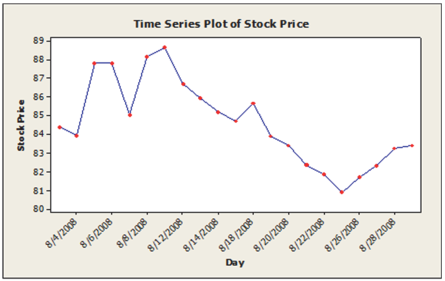
Daily closing stock prices for Kyocera Corporation were obtained from August 1, 2008 through August 29, 2008 and appear in the time series graph below.The dominant component in this time series is ________________________ .
(Multiple Choice)
4.8/5 (30)
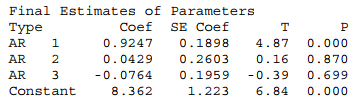
A third-order autoregressive model, AR (3) was fit to monthly closing stock prices, adjusted for dividends, of Boeing Corporation from January 2006 through August 2008 (closing price on the first trading day of the month).Based on the results shown below, the estimated model is ________________________ .
(Multiple Choice)
4.8/5 (42)
The table below shows the actual closing daily stock prices for Kyocera Corporation for September 2 through September 5, 2008, as well as 4-day moving average and naïve forecasts.The MAD for the Naïve method is 1.22.What is the MAD for the 4-period MA and how does it compare with the Naïve?

(Multiple Choice)
4.7/5 (33)
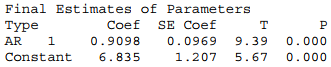
A first-order autoregressive model, AR (3) was fit to monthly closing stock prices, adjusted for dividends, of Boeing Corporation from January 2006 through August 2008 (closing price on the first trading day of the month).Based on the results shown below, the estimated model is ________________________ .
(Multiple Choice)
4.9/5 (34)
Quarterly sales data (in $10,000) for a small company specializing in green cleaning products are shown in the time series graph below.The forecasting method that would likely fit these data the best is ________________________
(Multiple Choice)
4.8/5 (40)
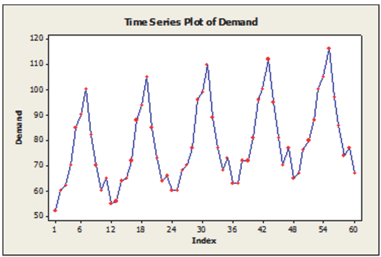
American Spinners, a large automobile parts supplier, keeps track of the demand for a particular part needed by its customers, automobile manufacturers.The time series plot below shows monthly demand for this part (in thousands) for a five year period.The dominant component in this time series is ________________________ .
(Multiple Choice)
5.0/5 (22)
Annual estimates of the population in Kauai County, Hawaii from 1999 (t = 1) onward are shown in the graph below.The most appropriate forecasting method for this series is ________________________ .
(Multiple Choice)
4.8/5 (32)
The table below shows the actual closing daily stock prices for Kyocera Corporation for September 2 through September 5, 2008.Suppose the forecast for Sept.2 is 81.88.Using SES (single exponential smoothing) with a smoothing constant of 0.2 (α = 0.2), what is the forecast for Sept.3?

(Multiple Choice)
4.8/5 (35)
The following table shows actual sales values and forecasts.The MSE for the forecasting method used is ________________________ .

(Multiple Choice)
4.9/5 (38)
The following table shows actual sales values and forecasts.The MAD for the forecasting method used is ________________________ .

(Multiple Choice)
4.8/5 (22)
Annual estimates of the population in the age group 65 + in Alameda County, California from 1999 (t = 1) onward are used to estimate the following quadratic trend model: Yt = 148187 - 554*t + 135.5*t**2.Using this model, the estimate for 2008 is ________________________ .
(Multiple Choice)
4.8/5 (38)
A quadratic trend model was fit to data on annual estimates of the population in the age group 65 + in Alameda County, California from 1999 (t = 1) onward.The results are shown below.Using this model, the estimate of population in the 65+ age group in Alameda County for 2008 (t = 10) is ________________________ .
Fitted Trend Equation: Yt = 148187 - 554*t + 135.5*t**2
(Multiple Choice)
4.9/5 (29)
Filters
- Essay(0)
- Multiple Choice(0)
- Short Answer(0)
- True False(0)
- Matching(0)