Exam 4: Correlation and Linear Regression
Exam 1: Data and Decisions29 Questions
Exam 2: Visualizing and Describing Categorical Data30 Questions
Exam 3: Describing, Displaying, and Visualizing Quantitative Data16 Questions
Exam 4: Correlation and Linear Regression21 Questions
Exam 5: Randomness and Probability22 Questions
Exam 6: Random Variables and Probability Models20 Questions
Exam 7: The Normal and Other Continuous Distributions20 Questions
Exam 8: Data Sources: Observational Studies and Surveys23 Questions
Exam 9: Data Sources: Experiments12 Questions
Exam 10: Sampling Distributions and Confidence Intervals for Proportio18 Questions
Exam 11: Confidence Intervals for Means20 Questions
Exam 12: Testing Hypotheses21 Questions
Exam 13: More About Tests and Intervals16 Questions
Exam 14: Comparing Two Means13 Questions
Exam 15: Inference for Counts: Chi-Square Tests17 Questions
Exam 16: Inference for Regression19 Questions
Exam 17: Understanding Residuals19 Questions
Exam 18: Multiple Regression18 Questions
Exam 19: Building Multiple Regression Models16 Questions
Exam 20: Time Series Analysis18 Questions
Exam 21: Introduction to Data Mining11 Questions
Exam 22: Quality Control20 Questions
Exam 23: Nonparametric Methods13 Questions
Exam 24: Decision Making and Risk19 Questions
Exam 25: Analysis of Experiments and Observational Studies9 Questions
Exam 26: Statistics and Data Analysis207 Questions
Select questions type
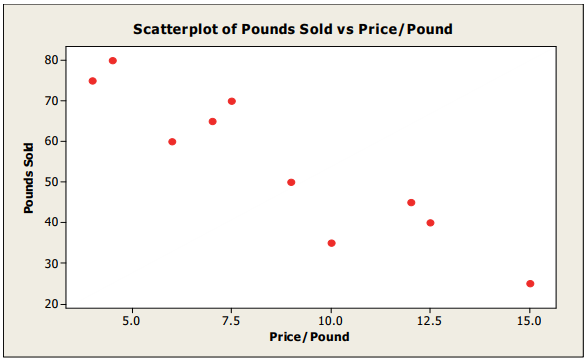
A small independent organic food store offers a variety of specialty coffees.To determine whether price has an impact on sales, the managers kept track of how many pounds of each variety of coffee were sold last month.
 Based on the data and summary statistics shown below, the slope of the estimated regression line that relates the response variable (monthly sales) to the predictor variable (price per pound) is ________________________ .
Free
(Multiple Choice)
4.8/5  (39)
(39)
Correct Answer: Verified
C
A supermarket chain gathers data on the amount they spend on promotional material (e.g., coupons, etc.) and sales revenue generated each quarter.The predictor variable is ________________________ .
Free
(Multiple Choice)
4.8/5 (31)
Correct Answer:Verified
B
A company studying the productivity of its employees on a new information system was interested in determining if the age (X) of data entry operators influenced the number of completed entries made per hour (Y).The regression equation is
)Suppose the actual completed entries per hour for an operator who is 35 years old was 8.The residual is _______ .
Free
(Multiple Choice)
4.9/5 (34)
Correct Answer:Verified
A
A small independent organic food store offers a variety of specialty coffees.To determine whether price has an impact on sales, the managers kept track of how many pounds of each variety of coffee were sold last month.Based on the scatterplot shown below, which of the following statements is true?
(Multiple Choice)
4.9/5 (26)
The scatterplot shows monthly sales figures (in units) and number of months of experience for a sample of salespeople.
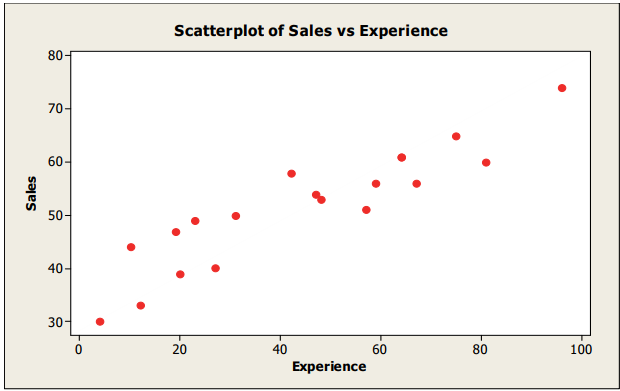 The association between monthly sales and level of experience can be described as ________________________ .
(Multiple Choice)
4.8/5 (38)
Data were collected on monthly sales revenues (in $1,000s) and monthly advertising expenditures ($100s) for a sample of drug stores.The regression line relating revenues (Y) to advertising expenditure (X) is estimated to be
)The correct interpretation of the slope is that for each additional ____________________________ .
(Multiple Choice)
4.8/5 (26)
Based on the following residual plot, which condition / assumption for linear regression is not satisfied?
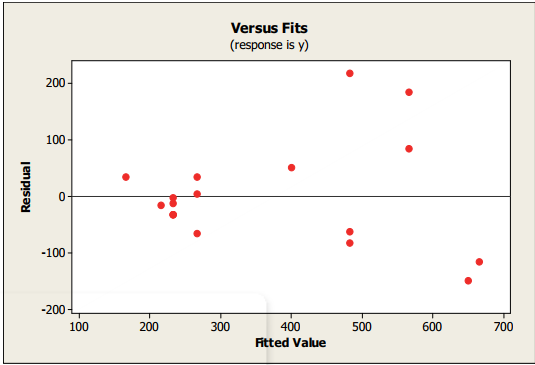 Border line missing for graph
(Multiple Choice)
4.9/5 (42)
A small independent organic food store offers a variety of specialty coffees.To determine whether price has an impact on sales, the managers kept track of how many pounds of each variety of coffee were sold last month.
 Based on the scatterplot, the linear relationship between number of pounds of coffee sold per week and price is ________________________ .
(Multiple Choice)
4.9/5 (35)
The scatterplot shows monthly sales figures (in units) and number of months of experience for a sample of salespeople.
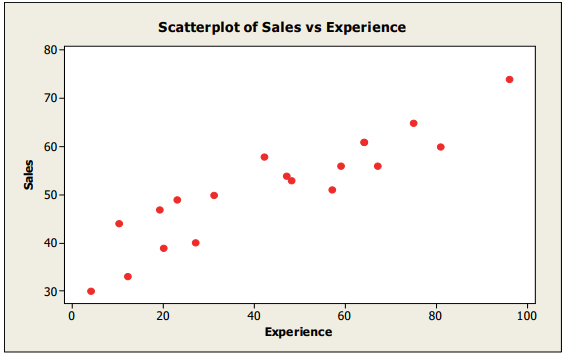 The correlation between monthly sales and level of experience is most ________________________ .
(Multiple Choice)
4.7/5 (30)
A small independent organic food store offers a variety of specialty coffees.To determine whether price has an impact on sales, the managers kept track of how many pounds of each variety of coffee were sold last month.
 Based on the data and summary statistics, the intercept of the estimated regression line that relates the response variable (monthly sales) to the predictor variable (price per pound) is ______________ .
(Multiple Choice)
4.9/5 (45)
A study examined consumption levels of oil and carbon dioxide emissions for sample of counties.The response variable in this study is ________________________ .
(Multiple Choice)
4.8/5 (35)
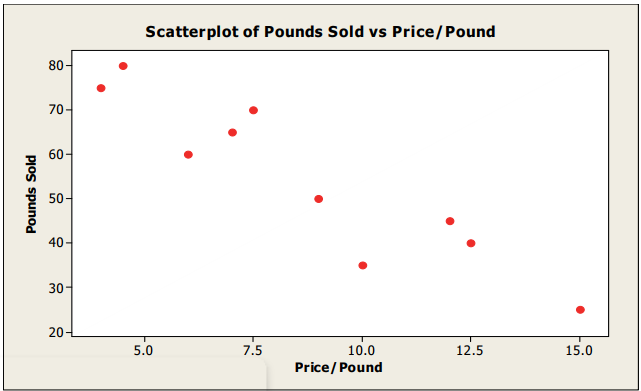
For the following scatterplot,
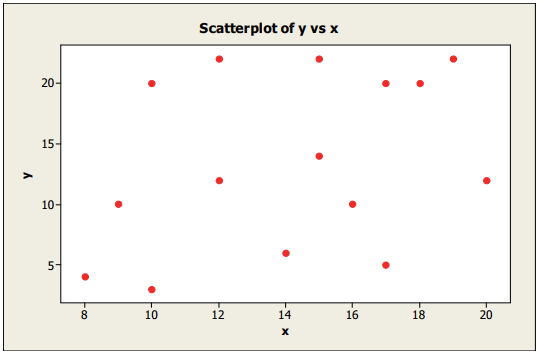 The likely correlation coefficient is ________________________ .
(Multiple Choice)
4.9/5 (37)
A company studying the productivity of their employees on a new information system was interested in determining if the age (X) of data entry operators influenced the number of completed entries made per hour (Y).The regression equation is
)If sx=14.04 and sy=2.61, then the correlation coefficient between age and productivity is ____ .
(Multiple Choice)
4.9/5 (38)
Suppose the correlation, r, between two variables x and y is -0.44.What percentage of the variability in y cannot be explained by x?
(Multiple Choice)
4.9/5 (32)
A small independent organic food store offers a variety of specialty coffees.To determine whether price has an impact on sales, the managers kept track of how many pounds of each variety of coffee were sold last month.
 Based on the summary statistics shown below, what percent of the variability in the number of pounds of coffee sold per week can be explained by price?
(Multiple Choice)
4.8/5 (39)
Shown below is a correlation table showing correlation coefficients between stock price, earnings per share (EPS) and price/earnings (P/E) ratio for a sample of 19 publicly traded companies.Which of the following statements is false?
Correlations: Stock Price, EPS, PE
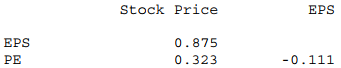
(Multiple Choice)
4.7/5 (41)
Data were collected on monthly sales revenues (in $1,000s) and monthly advertising expenditures ($100s) for a sample of drug stores.The regression line relating revenues (Y) to advertising expenditure (X) is estimated to be
)The predicted sales revenue for a month in which $1,000 was spent on advertising is ______________ .
(Multiple Choice)
4.9/5 (38)
The disadvantage of re-expressing variables is that ________________________ .
(Multiple Choice)
4.8/5 (41)
Suppose the correlation, r, between two variables x and y is -0.44.What would you predict about a y value if the x value is 2 standard deviations above its mean?
(Multiple Choice)
4.7/5 (33)
Linear regression was used to describe the trend in world population over time.Below is a plot of the residuals versus predicted values.What does the plot of residuals suggest?
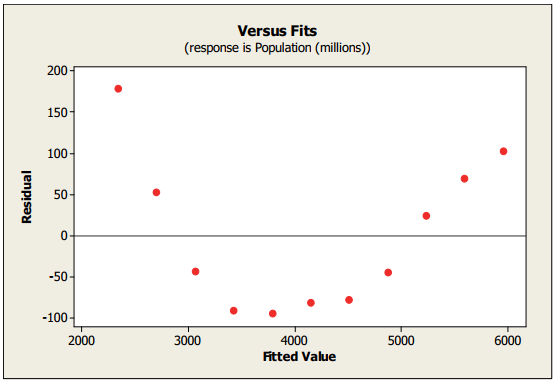
(Multiple Choice)
4.8/5 (27)
Filters
- Essay(0)
- Multiple Choice(0)
- Short Answer(0)
- True False(0)
- Matching(0)