Exam 3: Describing, Displaying, and Visualizing Quantitative Data
Exam 1: Data and Decisions29 Questions
Exam 2: Visualizing and Describing Categorical Data30 Questions
Exam 3: Describing, Displaying, and Visualizing Quantitative Data16 Questions
Exam 4: Correlation and Linear Regression21 Questions
Exam 5: Randomness and Probability22 Questions
Exam 6: Random Variables and Probability Models20 Questions
Exam 7: The Normal and Other Continuous Distributions20 Questions
Exam 8: Data Sources: Observational Studies and Surveys23 Questions
Exam 9: Data Sources: Experiments12 Questions
Exam 10: Sampling Distributions and Confidence Intervals for Proportio18 Questions
Exam 11: Confidence Intervals for Means20 Questions
Exam 12: Testing Hypotheses21 Questions
Exam 13: More About Tests and Intervals16 Questions
Exam 14: Comparing Two Means13 Questions
Exam 15: Inference for Counts: Chi-Square Tests17 Questions
Exam 16: Inference for Regression19 Questions
Exam 17: Understanding Residuals19 Questions
Exam 18: Multiple Regression18 Questions
Exam 19: Building Multiple Regression Models16 Questions
Exam 20: Time Series Analysis18 Questions
Exam 21: Introduction to Data Mining11 Questions
Exam 22: Quality Control20 Questions
Exam 23: Nonparametric Methods13 Questions
Exam 24: Decision Making and Risk19 Questions
Exam 25: Analysis of Experiments and Observational Studies9 Questions
Exam 26: Statistics and Data Analysis207 Questions
Select questions type
Here is the five number summary for salaries of U.S.marketing managers.
 The IQR is ________________________ .
Free
(Multiple Choice)
4.7/5  (34)
(34)
Correct Answer: Verified
B
Below is a histogram of salaries (in $) for a sample of U.S.marketing managers.
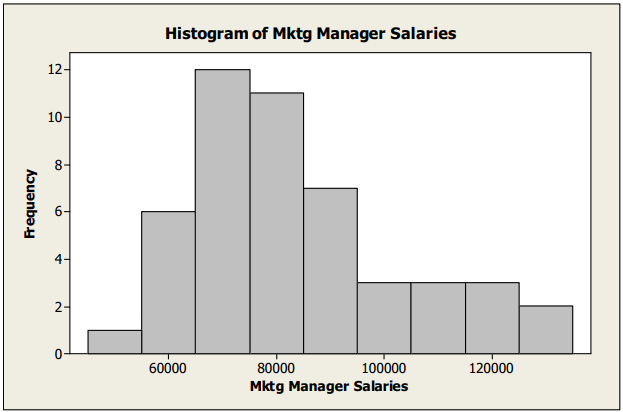 The shape of this distribution is ________________________ .
Free
(Multiple Choice)
4.9/5 (31)
Correct Answer:Verified
C
The following table shows total assets ($ billion) for a small sample of U.S.banks.
 The standard deviation for these data is ________________________ .
Free
(Multiple Choice)
4.7/5 (28)
Correct Answer:Verified
B
The following table shows total assets ($ billion) for a small sample of U.S.banks.
 The z- score for the total assets of Fifth Third Bank is ________________________ .
(Multiple Choice)
4.7/5 (39)
The following table shows total assets ($ billion) for a small sample of U.S.banks.
 The mean for these data is ________________________ .
(Multiple Choice)
4.8/5 (30)
Consider the five number summary of hourly wages ($) for a sample of sales managers.Suppose the mean hourly wage is $38.50.What can we say about the shape of the distribution?

(Multiple Choice)
4.8/5 (35)
The following table shows representative recent closing share prices for a small sample of companies based in India in late 2013.
 The standard deviation in closing share prices is ________________________ .
(Multiple Choice)
4.8/5 (41)
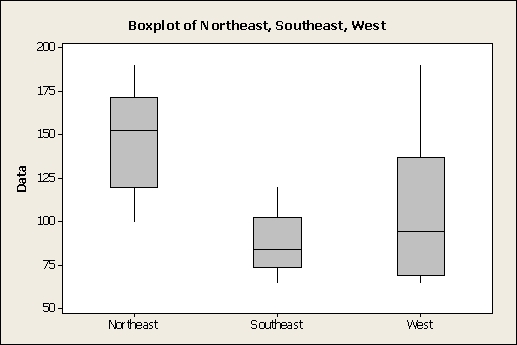
The following boxplots show monthly sales revenue figures ($ thousands) for a discount office supply company with locations in three different regions of the U.S.(Northeast, Southeast, and West).Which of the following statements is false?
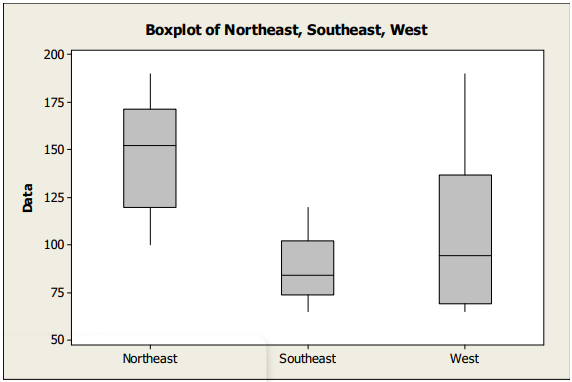
(Multiple Choice)
4.9/5 (22)
The following table shows data for total assets ($ billion) for a small sample of U.S.banks (late 2013).
 The mean for the total assets data ($ billion) is ________________________ .
(Multiple Choice)
4.9/5 (35)
Consider the five number summary of hourly wages ($) for a sample of sales managers.
 The IQR for these data is ________________________ .
(Multiple Choice)
4.8/5 (35)
The ASQ (American Society for Quality) regularly conducts a salary survey of its membership, primarily quality management professionals.Based on the most recently published mean and standard deviation, a quality control specialist calculated the z-score associated with his own salary and found it was -2.50.This tells him that his salary ________________________ .
(Multiple Choice)
4.7/5 (37)
The following boxplots show monthly sales revenue figures ($ thousands) for a discount office supply company with locations in three different regions of the U.S.(Northeast, Southeast, and West).Which of the following statements is true?
(Multiple Choice)
4.9/5 (40)
Consider the five number summary of hourly wages ($) for a sample of sales managers.
 The range for these data is ________________________ .
(Multiple Choice)
4.9/5 (37)
The following table shows representative recent closing share prices in late 2013 for a small sample of companies based in India.
 The z score for the share price for ABC Paper is ________________________ .
(Multiple Choice)
4.8/5 (28)
Below is a histogram of salaries (in $) for a sample of U.S.marketing managers.
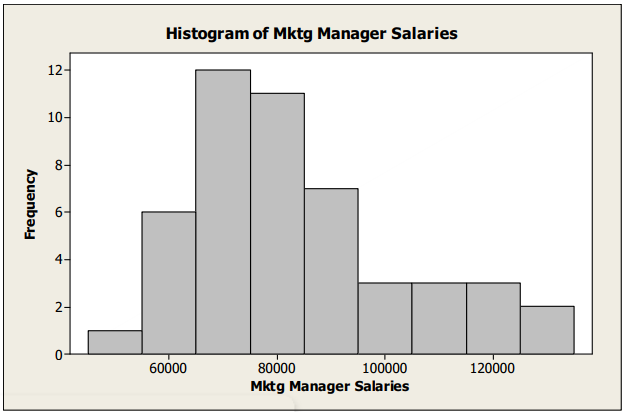 The most appropriate measure of central tendency for these data is the ________________________ .
(Multiple Choice)
4.7/5 (34)
Consider the five number summary of hourly wages ($) for a sample of advertising / promotion managers.
 Suppose there had been an error and that the lowest hourly wage was $15.50 instead of $19.64.This would result in ________________________ .
(Multiple Choice)
4.9/5 (30)
Filters
- Essay(0)
- Multiple Choice(0)
- Short Answer(0)
- True False(0)
- Matching(0)