Exam 2: Visualizing and Describing Categorical Data
Exam 1: Data and Decisions29 Questions
Exam 2: Visualizing and Describing Categorical Data30 Questions
Exam 3: Describing, Displaying, and Visualizing Quantitative Data16 Questions
Exam 4: Correlation and Linear Regression21 Questions
Exam 5: Randomness and Probability22 Questions
Exam 6: Random Variables and Probability Models20 Questions
Exam 7: The Normal and Other Continuous Distributions20 Questions
Exam 8: Data Sources: Observational Studies and Surveys23 Questions
Exam 9: Data Sources: Experiments12 Questions
Exam 10: Sampling Distributions and Confidence Intervals for Proportio18 Questions
Exam 11: Confidence Intervals for Means20 Questions
Exam 12: Testing Hypotheses21 Questions
Exam 13: More About Tests and Intervals16 Questions
Exam 14: Comparing Two Means13 Questions
Exam 15: Inference for Counts: Chi-Square Tests17 Questions
Exam 16: Inference for Regression19 Questions
Exam 17: Understanding Residuals19 Questions
Exam 18: Multiple Regression18 Questions
Exam 19: Building Multiple Regression Models16 Questions
Exam 20: Time Series Analysis18 Questions
Exam 21: Introduction to Data Mining11 Questions
Exam 22: Quality Control20 Questions
Exam 23: Nonparametric Methods13 Questions
Exam 24: Decision Making and Risk19 Questions
Exam 25: Analysis of Experiments and Observational Studies9 Questions
Exam 26: Statistics and Data Analysis207 Questions
Select questions type
A consulting firm examined the profit of two grocery stores and found that over the last year at Grocery Store A 66.7% of the months showed profit while at Grocery Store B 83.3% showed profit.The table below summarizes the findings.
 On closer investigation, it was observed that there was a difference in profit between stores that served wealthier neighborhoods versus less wealthy.The following tables were created:
Grocery stores serving wealthy neighborhoods:
On closer investigation, it was observed that there was a difference in profit between stores that served wealthier neighborhoods versus less wealthy.The following tables were created:
Grocery stores serving wealthy neighborhoods:
 Grocery stores serving less wealthy neighborhoods:
 What can be assumed about the profit of grocery stores?
(Multiple Choice)
4.8/5  (34)
(34)
The following is a bar chart summarizing consumer preferences for various brands of digital cameras.
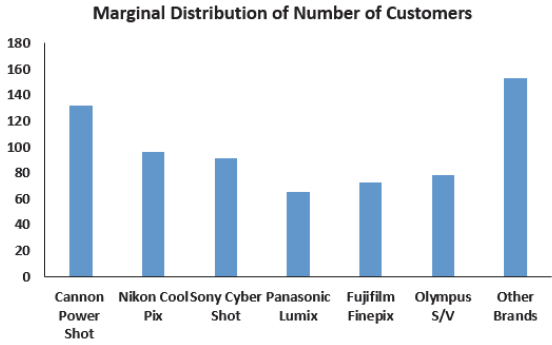 This bar chart shows _____________________ .
(Multiple Choice)
4.7/5 (39)
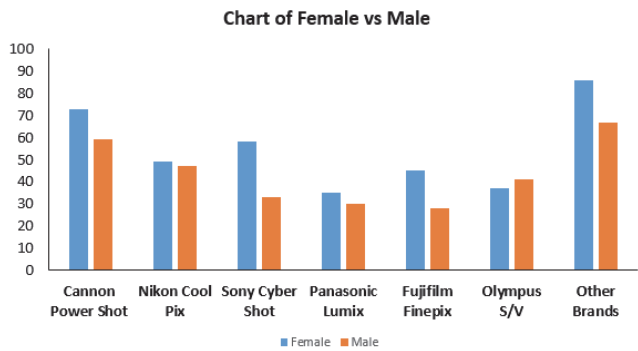
Based on the side-by-side bar chart summarizing consumer preferences for various brands of digital cameras by gender, which of the following statement(s) are true?
(Multiple Choice)
4.8/5 (43)
Accenture, a consulting firm, conducted an online survey of 500 US consumers in September 2013.Based on their response to the question "What is your motive for shopping late in the season?" which of the following would be an appropriate method for displaying the data shown in the table?

(Multiple Choice)
4.9/5 (33)
Accenture, a consulting firm, conducted an online survey of 500 US consumers from in 2013.
 What percentage of men were felt that better discounts were available on "Black Friday"?
(Multiple Choice)
4.9/5 (37)
Here is a stacked bar chart for data collected about employee blood pressure.
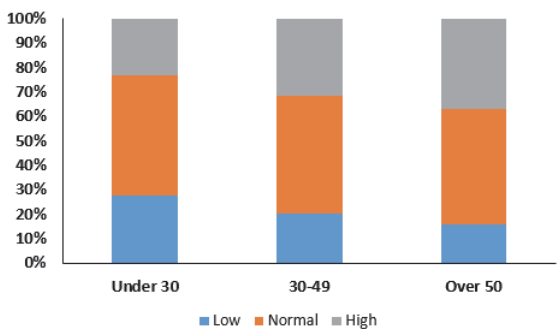 This chart shows _____________________ .
(Multiple Choice)
4.9/5 (37)
A regional survey was carried out to gauge public opinion on the controversial Arizona Immigration Law (results shown below).What percent oppose the law?

(Multiple Choice)
4.8/5 (43)
A clothing store uses comment cards to get feedback from its customers about newly added items.It recently introduced plus size fashion wear.Customers who purchased the items were asked to fill out an online comment survey giving 10% off the next purchase.The data are summarized in the table below.What percentage of customers were at least satisfied with the item(s) purchased (Satisfied or Very satisfied)?

(Multiple Choice)
4.9/5 (40)
A clothing store uses comment cards to get feedback from its customers about newly added items.It recently introduced plus size fashion wear.Customers who purchased the items were asked to fill out an online comment survey giving 10% off the next purchase.The data are summarized in the table below.What percentage of customers would be less likely to purchase another item (Less or Not fully satisfied)?

(Multiple Choice)
4.9/5 (31)
A large national retailer of electronics conducted a survey to determine consumer preferences for various brands of digital cameras and the data are summarized in the table shown below.Of the consumers who prefer Olympus, what percentage is female?

(Multiple Choice)
4.9/5 (34)
Filters
- Essay(0)
- Multiple Choice(0)
- Short Answer(0)
- True False(0)
- Matching(0)