Exam 32: A Macroeconomic Theory of the Open Economy
Exam 1: Ten Principles of Economics220 Questions
Exam 2: Thinking Like an Economist284 Questions
Exam 3: Interdependence and the Gains From Trade192 Questions
Exam 4: The Market Forces of Supply and Demand277 Questions
Exam 5: Elasticity and Its Application222 Questions
Exam 6: Supply, Demand, and Government Policies321 Questions
Exam 7: Consumers, Producers, and the Efficiency of Markets218 Questions
Exam 8: Applications: The Costs of Taxation203 Questions
Exam 9: Application: International Trade214 Questions
Exam 10: Externalities204 Questions
Exam 11: Public Goods and Common Resources182 Questions
Exam 12: The Design of the Tax System225 Questions
Exam 13: The Costs of Production261 Questions
Exam 14: Firms in Competitive Markets243 Questions
Exam 15: Monopoly231 Questions
Exam 16: Monopolistic Competition246 Questions
Exam 17: Oligopoly204 Questions
Exam 18: The Markets for the Factors of Production232 Questions
Exam 19: Earnings and Discrimination230 Questions
Exam 20: Income Inequality and Poverty194 Questions
Exam 21: The Theory of Consumer Choice209 Questions
Exam 22: Frontiers in Microeconomics185 Questions
Exam 23: Measuring a Nations Income231 Questions
Exam 24: Measuring the Cost of Living214 Questions
Exam 25: Production and Growth187 Questions
Exam 26: Saving, Investment, and the Financial System225 Questions
Exam 27: Tools of Finance198 Questions
Exam 28: Unemployment and Its Natural Rate361 Questions
Exam 29: The Monetary System210 Questions
Exam 30: Money Growth and Inflation201 Questions
Exam 31: Open-Economy Macroeconomics: Basic Concepts194 Questions
Exam 32: A Macroeconomic Theory of the Open Economy188 Questions
Exam 33: Aggregate Demand and Aggregate Supply189 Questions
Exam 34: The Influence of Monetary and Fiscal Policy on Aggregate Demand207 Questions
Exam 35: The Short-Run Tradeoff Between Inflation and Unemployment223 Questions
Exam 36: Six Debates Over Macroeconomic Policy154 Questions
Select questions type
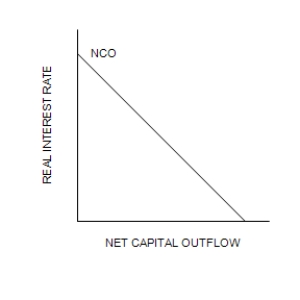
Net capital outflow represents the quantity of dollars supplied in the foreign-currency exchange market.
(True/False)
4.8/5  (21)
(21)
When a country imposes a trade restriction, the real exchange rate of that country's currency appreciates.
(True/False)
4.8/5 (33)
Capital flight raises both a country's exchange rate and its interest rate.
(True/False)
4.8/5 (28)
In the open-economy macroeconomic model, the real exchange rate does not affect net capital outflow.
(True/False)
5.0/5 (30)
Capital flight shifts the demand for loanable funds to the left.
(True/False)
4.9/5 (37)
In the open-economy macroeconomic model, if there is currently a surplus in the foreign exchange market, the quantity of desired net exports will increase as the market moves to equilibrium.
(True/False)
4.9/5 (38)
What is the source of the demand for dollars in the market for foreign-currency exchange?
(Short Answer)
4.7/5 (32)
If real interest rates rose less in U.K. than in the United States, then other things the same
(Multiple Choice)
4.7/5 (27)
As the interest rate rises, it is possible that net capital outflow could move from a positive to a negative value.
(True/False)
4.8/5 (33)
Figure 32-5
Refer to the following diagram of the open-economy macroeconomic model to answer the questions that follow.
Graph (a)
Graph (b) 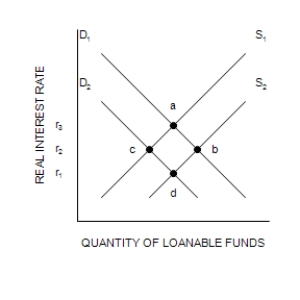
 Graph (c)
 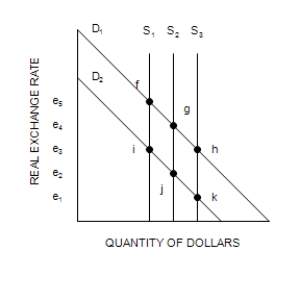 -Refer to Figure 32-5. Suppose that initially the economy is in equilibrium at r1 (point d) and e3 (point i). If the government removes import quotas, the exchange rate will move to
(Multiple Choice)
4.8/5 (38)
When the government budget deficit increases, national saving decreases.
(True/False)
4.8/5 (33)
Scenario 32-4
In 2011 Greek citizens were concerned about the size of government debt. Fearful that the government might be unable to fulfill its promise to insure depositors in Greek banks against losses created by bank failures, depositors moved funds out of Greek banks.
-Refer to Scenario 32-4. Which curve in the domestic loanable funds market shifted and which direction did it shift?
(Essay)
4.9/5 (34)
A tax credit for purchases of capital goods causes the interest rate to increase and the exchange rate to appreciate.
(True/False)
4.8/5 (32)
What is the source of the supply of loanable funds in the open-economy macroeconomic model?
(Short Answer)
4.8/5 (29)
Figure 32-5
Refer to the following diagram of the open-economy macroeconomic model to answer the questions that follow.
Graph (a)
Graph (b) Graph (c)
-Refer to Figure 32-5. If the interest rate were initially at r2 and an import quota were imposed, the interest rate would
(Multiple Choice)
4.8/5 (38)
Figure 32-4
Refer to the following diagram of the open-economy macroeconomic model to answer the questions that follow.
Graph (a) 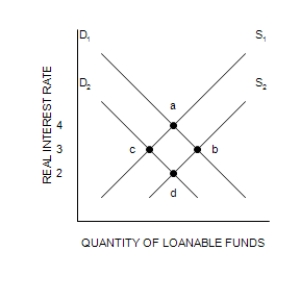 Graph (b)
 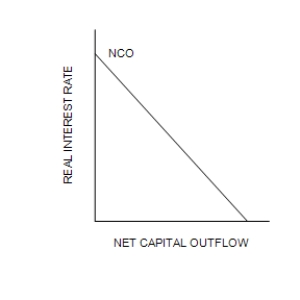 Graph (c)
 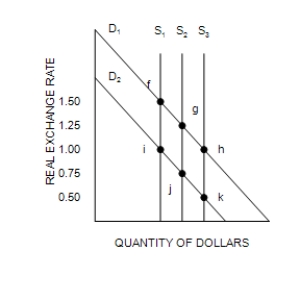 -Refer to Figure 32-4. In the market for foreign-currency exchange, the effects of an increase in the budget surplus shown in graph (c) can be illustrated as a move from j to
(Multiple Choice)
4.9/5 (33)
Figure 32-2 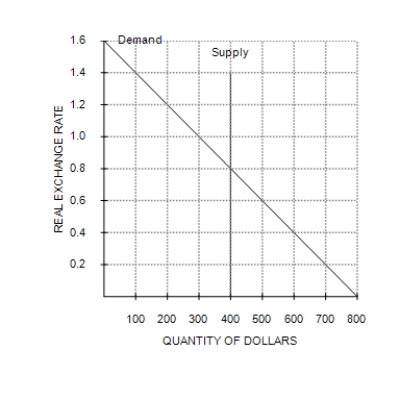 -Refer to Figure 32-2. If the real exchange rate is 1, then there is a
(Multiple Choice)
4.9/5 (32)
If for some reason U.S. residents increase their purchases of foreign assets, then all else constant which curve in the market for foreign-currency exchange shifts and which direction does it shift? What happens to the exchange rate?
(Essay)
4.8/5 (35)
Filters
- Essay(0)
- Multiple Choice(0)
- Short Answer(0)
- True False(0)
- Matching(0)