Exam 8: Applications: The Costs of Taxation
Exam 1: Ten Principles of Economics220 Questions
Exam 2: Thinking Like an Economist284 Questions
Exam 3: Interdependence and the Gains From Trade192 Questions
Exam 4: The Market Forces of Supply and Demand277 Questions
Exam 5: Elasticity and Its Application222 Questions
Exam 6: Supply, Demand, and Government Policies321 Questions
Exam 7: Consumers, Producers, and the Efficiency of Markets218 Questions
Exam 8: Applications: The Costs of Taxation203 Questions
Exam 9: Application: International Trade214 Questions
Exam 10: Externalities204 Questions
Exam 11: Public Goods and Common Resources182 Questions
Exam 12: The Design of the Tax System225 Questions
Exam 13: The Costs of Production261 Questions
Exam 14: Firms in Competitive Markets243 Questions
Exam 15: Monopoly231 Questions
Exam 16: Monopolistic Competition246 Questions
Exam 17: Oligopoly204 Questions
Exam 18: The Markets for the Factors of Production232 Questions
Exam 19: Earnings and Discrimination230 Questions
Exam 20: Income Inequality and Poverty194 Questions
Exam 21: The Theory of Consumer Choice209 Questions
Exam 22: Frontiers in Microeconomics185 Questions
Exam 23: Measuring a Nations Income231 Questions
Exam 24: Measuring the Cost of Living214 Questions
Exam 25: Production and Growth187 Questions
Exam 26: Saving, Investment, and the Financial System225 Questions
Exam 27: Tools of Finance198 Questions
Exam 28: Unemployment and Its Natural Rate361 Questions
Exam 29: The Monetary System210 Questions
Exam 30: Money Growth and Inflation201 Questions
Exam 31: Open-Economy Macroeconomics: Basic Concepts194 Questions
Exam 32: A Macroeconomic Theory of the Open Economy188 Questions
Exam 33: Aggregate Demand and Aggregate Supply189 Questions
Exam 34: The Influence of Monetary and Fiscal Policy on Aggregate Demand207 Questions
Exam 35: The Short-Run Tradeoff Between Inflation and Unemployment223 Questions
Exam 36: Six Debates Over Macroeconomic Policy154 Questions
Select questions type
Which of the following quantities decrease in response to a tax on a good?
Free
(Multiple Choice)
4.7/5  (26)
(26)
Correct Answer: Verified
B
Total surplus is always equal to the sum of consumer surplus and producer surplus.
Free
(True/False)
4.9/5 (30)
Correct Answer:Verified
False
Figure 8-2
The vertical distance between points C and D represents a tax in the market.
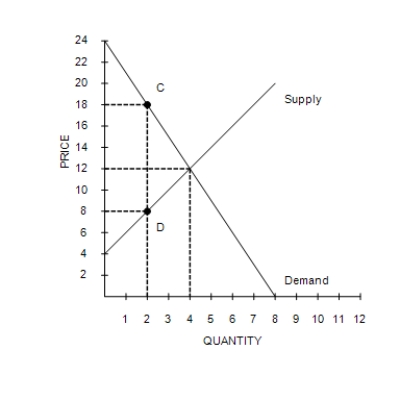
-Refer to Figure 8-2. The per-unit burden of the tax on sellers is
-Refer to Figure 8-2. The per-unit burden of the tax on sellers is
Free
(Multiple Choice)
4.8/5 (35)
Correct Answer:Verified
A
Figure 8-1 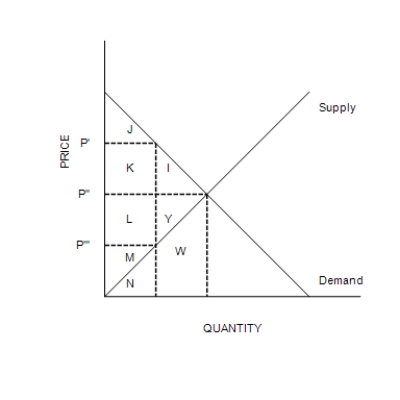 -Refer to Figure 8-1. Suppose the government imposes a tax of P'-P'''. Total surplus after the tax is measured by the area
(Multiple Choice)
4.9/5 (23)
Figure 8-3
The vertical distance between points A and B represents a tax in the market. 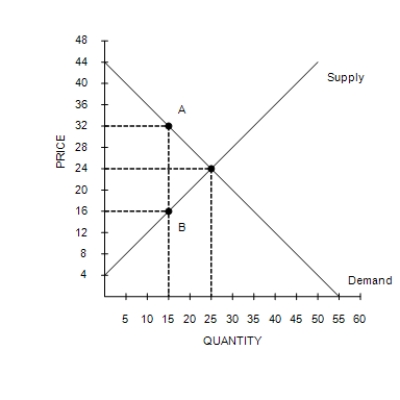 -Refer to Figure 8-3. The deadweight loss associated with this tax amounts to
(Multiple Choice)
4.9/5 (36)
Using demand and supply diagrams, show the difference in deadweight loss between (a) a market with inelastic demand and supply and (b) a market with elastic demand and supply.
(Essay)
4.9/5 (39)
Suppose a tax is imposed on bananas. In which of the following cases will the tax cause the equilibrium quantity of bananas to shrink by the largest amount?
(Multiple Choice)
4.8/5 (40)
Suppose that the market for product X is characterized by a typical, downward-sloping, linear demand curve and a typical, upward-sloping, linear supply curve. If a $2 tax per unit results in a deadweight loss of $200, how large would be the deadweight loss from a $6 tax per unit?
(Essay)
4.9/5 (28)
When a tax is imposed, the loss of consumer surplus and producer surplus as a result of the tax exceeds the tax revenue collected by the government.
(True/False)
4.8/5 (39)
Suppose that a university charges students a $100 "tax" to register for business classes. The next year the university raises the "tax" to $150. The deadweight loss from the "tax" triples.
(True/False)
4.9/5 (27)
Figure 8-2
The vertical distance between points C and D represents a tax in the market.
-Refer to Figure 8-2. The amount of the tax on each unit of the good is
(Multiple Choice)
4.9/5 (37)
Provide several examples of important taxes on labor in the United States. For a typical worker, what is the marginal tax rate on labor income once all the labor taxes are summed?
(Essay)
4.8/5 (36)
Refer to Scenario 8-3. Suppose that a tax of T is placed on buyers so that the demand curve becomes:
If T = 40, how much is the burden of the tax on the buyers and on the sellers?
(Essay)
4.8/5 (40)
Figure 8-10
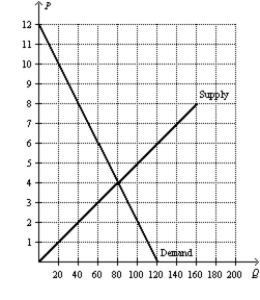
-Refer to Figure 8-10. Suppose the government places a $3 tax per unit on this good. What price will sellers receive for the good after the tax is imposed?
-Refer to Figure 8-10. Suppose the government places a $3 tax per unit on this good. What price will sellers receive for the good after the tax is imposed?
(Essay)
4.8/5 (27)
The demand for energy drinks is more elastic than the demand for milk. Would a tax on energy drinks or a tax on milk have a larger deadweight loss? Explain.
(Essay)
4.8/5 (38)
Figure 8-3
The vertical distance between points A and B represents a tax in the market.
-Refer to Figure 8-3. Which of the following statements is correct?
(Multiple Choice)
4.9/5 (30)
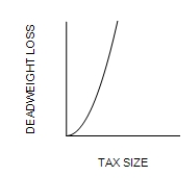
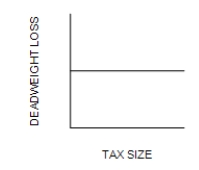
Figure 8-8
Graph (a)
 Graph (b)
 Graph (c)
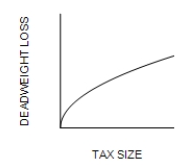
-Refer to Figure 8-8. Which graph correctly illustrates the relationship between the size of a tax and the size of the deadweight loss associated with the tax?
-Refer to Figure 8-8. Which graph correctly illustrates the relationship between the size of a tax and the size of the deadweight loss associated with the tax?
(Multiple Choice)
4.9/5 (33)
Taxes drive a wedge into the market by raising the price that sellers receive and lowering the price that buyers pay.
(True/False)
4.8/5 (35)
Taxes on labor tend to increase the number of hours that people choose to work.
(True/False)
4.7/5 (35)
Filters
- Essay(0)
- Multiple Choice(0)
- Short Answer(0)
- True False(0)
- Matching(0)