Exam 21: The Theory of Consumer Choice
Exam 1: Ten Principles of Economics220 Questions
Exam 2: Thinking Like an Economist284 Questions
Exam 3: Interdependence and the Gains From Trade192 Questions
Exam 4: The Market Forces of Supply and Demand277 Questions
Exam 5: Elasticity and Its Application222 Questions
Exam 6: Supply, Demand, and Government Policies321 Questions
Exam 7: Consumers, Producers, and the Efficiency of Markets218 Questions
Exam 8: Applications: The Costs of Taxation203 Questions
Exam 9: Application: International Trade214 Questions
Exam 10: Externalities204 Questions
Exam 11: Public Goods and Common Resources182 Questions
Exam 12: The Design of the Tax System225 Questions
Exam 13: The Costs of Production261 Questions
Exam 14: Firms in Competitive Markets243 Questions
Exam 15: Monopoly231 Questions
Exam 16: Monopolistic Competition246 Questions
Exam 17: Oligopoly204 Questions
Exam 18: The Markets for the Factors of Production232 Questions
Exam 19: Earnings and Discrimination230 Questions
Exam 20: Income Inequality and Poverty194 Questions
Exam 21: The Theory of Consumer Choice209 Questions
Exam 22: Frontiers in Microeconomics185 Questions
Exam 23: Measuring a Nations Income231 Questions
Exam 24: Measuring the Cost of Living214 Questions
Exam 25: Production and Growth187 Questions
Exam 26: Saving, Investment, and the Financial System225 Questions
Exam 27: Tools of Finance198 Questions
Exam 28: Unemployment and Its Natural Rate361 Questions
Exam 29: The Monetary System210 Questions
Exam 30: Money Growth and Inflation201 Questions
Exam 31: Open-Economy Macroeconomics: Basic Concepts194 Questions
Exam 32: A Macroeconomic Theory of the Open Economy188 Questions
Exam 33: Aggregate Demand and Aggregate Supply189 Questions
Exam 34: The Influence of Monetary and Fiscal Policy on Aggregate Demand207 Questions
Exam 35: The Short-Run Tradeoff Between Inflation and Unemployment223 Questions
Exam 36: Six Debates Over Macroeconomic Policy154 Questions
Select questions type
Figure 21-7
The following graph shows three possible indifference curves (I) for a consumer. 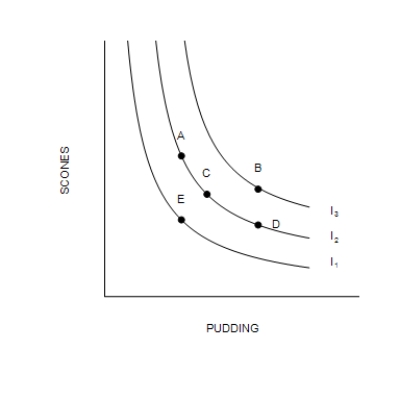
-Refer to Figure 21-7. Which of the following statements is correct?
-Refer to Figure 21-7. Which of the following statements is correct?
Free
(Multiple Choice)
4.9/5  (35)
(35)
Correct Answer: Verified
B
The direction of the substitution effect is not influenced by whether the good is normal or inferior.
Free
(True/False)
4.8/5 (35)
Correct Answer:Verified
True
Explain the relationship between the budget constraint and indifference curve at a consumer's optimum.
Free
(Essay)
4.9/5 (34)
Correct Answer:Verified
Because the budget constraint is tangent to the indifference curve at a consumer's optimum, the slope of the budget constraint (relative market prices) and the slope of the indifference curve (the marginal rate of substitution) are equal at the optimal consumption point and only at that point.
The substitution effect in the work-leisure model induces a person to work less in response to higher wages, which tends to make the labor-supply curve slope upward.
(True/False)
4.9/5 (35)
Figure 21-18
The figure shows two indifference curves and two budget constraints for a consumer named Kevin.
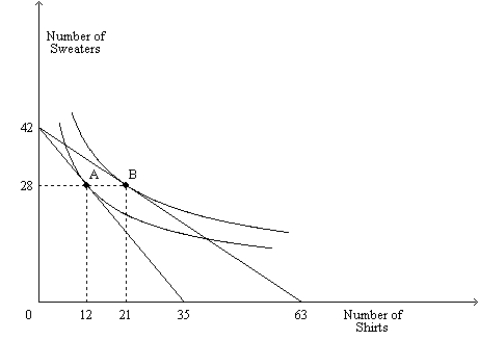
-Refer to Figure 21-18. If Kevin's income is $1,260 and point A is his optimum, then what is the price of a shirt?
-Refer to Figure 21-18. If Kevin's income is $1,260 and point A is his optimum, then what is the price of a shirt?
(Short Answer)
4.8/5 (42)
List and briefly explain each of the four properties of indifference curves.
(Essay)
4.7/5 (37)
Susie wins $2 million in her state's lottery. If Susie keeps working after she wins the money, we can infer that the income effect is larger than the substitution effect for her.
(True/False)
4.9/5 (41)
Suppose Caroline is indifferent between tea and coffee as long as she consumes an equivalent amount of caffeine. Suppose that coffee has twice as much caffeine as tea. Which graph would illustrate a representative indifference curve?
(Multiple Choice)
4.8/5 (30)
When two goods are perfect complements, the indifference curves are right angles.
(True/False)
4.9/5 (33)
Consider the indifference curve map and budget constraint for two goods, beef and potatoes. Suppose the good measured on the horizontal axis, potatoes, is a Giffen good. Beef is measured on the vertical axis and is a normal good. When the price of potatoes increases, the substitution effect causes
(Multiple Choice)
4.8/5 (30)
A consumer maximizes utility at a point where multiple indifference curves intersect the budget line.
(True/False)
4.9/5 (32)
Figure 21-5 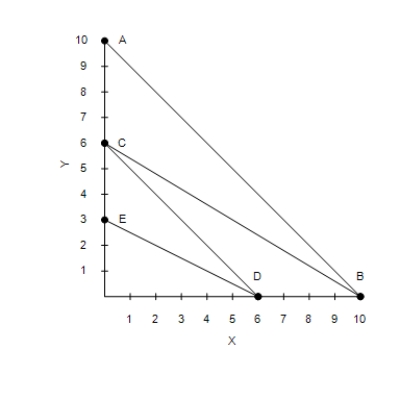 -Refer to Figure 21-5. You have $36 to spend on good X and good Y. If good X costs $6 and good Y costs $12, your budget constraint is
(Multiple Choice)
4.8/5 (28)
Figure 21-19
The figure shows three indifference curves and a budget constraint for a consumer named Hannah. When young, Hannah works and earns income. When old, she is retired and earns no income.
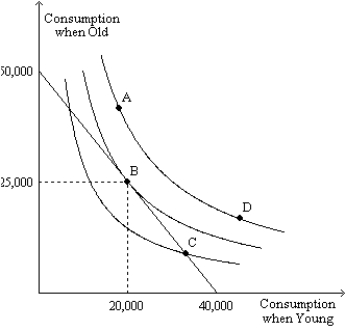
-Refer to Figure 21-19. Of the four labeled points, which is (are) affordable to Hannah?
-Refer to Figure 21-19. Of the four labeled points, which is (are) affordable to Hannah?
(Short Answer)
4.7/5 (31)
The indifference curves for nickels and dimes are straight lines.
(True/False)
4.8/5 (31)
The indifference curves for left gloves and right gloves are straight lines.
(True/False)
4.9/5 (42)
Figure 21-7
The following graph shows three possible indifference curves (I) for a consumer.
-Refer to Figure 21-7. Which of the following comparisons is correct regarding the marginal rate of substitution (MRS) of scones for pudding?
(Multiple Choice)
4.9/5 (28)
Using indifference curves and budget constraints, graphically illustrate the substitution and income effect that would result from a change in the price of a normal good.
(Essay)
4.9/5 (32)
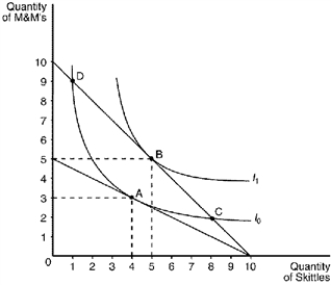
Using the graph shown, construct a demand curve for M&M's given an income of $10.
(Essay)
4.8/5 (32)
At a consumer's optimal choice, the consumer chooses the combination of goods that equates the marginal rate of substitution and the price ratio.
(True/False)
4.7/5 (29)
For a typical consumer, indifference curves can intersect if they satisfy the property of transitivity.
(True/False)
4.7/5 (29)
Filters
- Essay(0)
- Multiple Choice(0)
- Short Answer(0)
- True False(0)
- Matching(0)