Exam 21: The Theory of Consumer Choice
Exam 1: Ten Principles of Economics220 Questions
Exam 2: Thinking Like an Economist284 Questions
Exam 3: Interdependence and the Gains From Trade192 Questions
Exam 4: The Market Forces of Supply and Demand277 Questions
Exam 5: Elasticity and Its Application222 Questions
Exam 6: Supply, Demand, and Government Policies321 Questions
Exam 7: Consumers, Producers, and the Efficiency of Markets218 Questions
Exam 8: Applications: The Costs of Taxation203 Questions
Exam 9: Application: International Trade214 Questions
Exam 10: Externalities204 Questions
Exam 11: Public Goods and Common Resources182 Questions
Exam 12: The Design of the Tax System225 Questions
Exam 13: The Costs of Production261 Questions
Exam 14: Firms in Competitive Markets243 Questions
Exam 15: Monopoly231 Questions
Exam 16: Monopolistic Competition246 Questions
Exam 17: Oligopoly204 Questions
Exam 18: The Markets for the Factors of Production232 Questions
Exam 19: Earnings and Discrimination230 Questions
Exam 20: Income Inequality and Poverty194 Questions
Exam 21: The Theory of Consumer Choice209 Questions
Exam 22: Frontiers in Microeconomics185 Questions
Exam 23: Measuring a Nations Income231 Questions
Exam 24: Measuring the Cost of Living214 Questions
Exam 25: Production and Growth187 Questions
Exam 26: Saving, Investment, and the Financial System225 Questions
Exam 27: Tools of Finance198 Questions
Exam 28: Unemployment and Its Natural Rate361 Questions
Exam 29: The Monetary System210 Questions
Exam 30: Money Growth and Inflation201 Questions
Exam 31: Open-Economy Macroeconomics: Basic Concepts194 Questions
Exam 32: A Macroeconomic Theory of the Open Economy188 Questions
Exam 33: Aggregate Demand and Aggregate Supply189 Questions
Exam 34: The Influence of Monetary and Fiscal Policy on Aggregate Demand207 Questions
Exam 35: The Short-Run Tradeoff Between Inflation and Unemployment223 Questions
Exam 36: Six Debates Over Macroeconomic Policy154 Questions
Select questions type
Figure 21-18
The figure shows two indifference curves and two budget constraints for a consumer named Kevin.
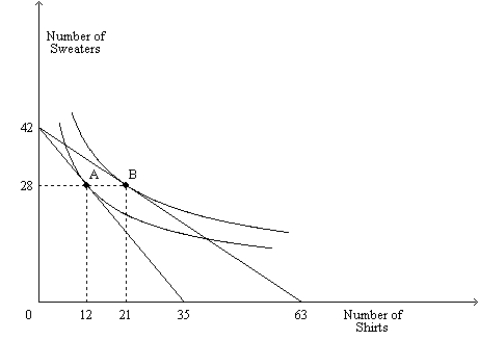
-Refer to Figure 21-18. Suppose Kevin is optimally purchasing 12 shirts and 28 sweaters, and he is spending $648 on shirts. What is the price of a sweater?
-Refer to Figure 21-18. Suppose Kevin is optimally purchasing 12 shirts and 28 sweaters, and he is spending $648 on shirts. What is the price of a sweater?
(Essay)
4.7/5  (36)
(36)
Figure 21-6  -Refer to Figure 21-6. If the price of good Y is $5, what is the price of good X?
(Multiple Choice)
4.8/5 (26)
Tyler consumes two goods, wheat and steak. When the price of steak rises, he consumes less steak. When the price of wheat rises, he consumes more wheat. For Tyler,
(Multiple Choice)
4.9/5 (34)
A family on a trip budgets $800 for meals and hotel accommodations. Suppose the price of a meal is $40. In addition, suppose the family could afford a total of eight nights in a hotel if they don't buy any meals. How many meals could the family afford if they gave up two nights in the hotel?
(Multiple Choice)
4.8/5 (30)
Figure 21-11 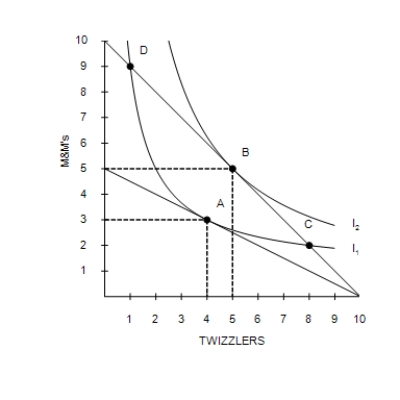 -Refer to Figure 21-11. Assume that the consumer depicted in the figure has an income of $10. The price of Twizzlers is $1 and the price of M&M's is $2. The consumer's optimal choice is point
(Multiple Choice)
4.9/5 (30)
When a consumer is purchasing the best combination of two goods, X and Y, subject to a budget constraint, we say that the consumer is at an optimal choice point. A graph of an optimal choice point shows that it occurs
(Multiple Choice)
4.9/5 (35)
The labor supply curve may have a backward-bending portion if, at higher wages, the income effect is
(Multiple Choice)
4.8/5 (45)
Figure 21-12 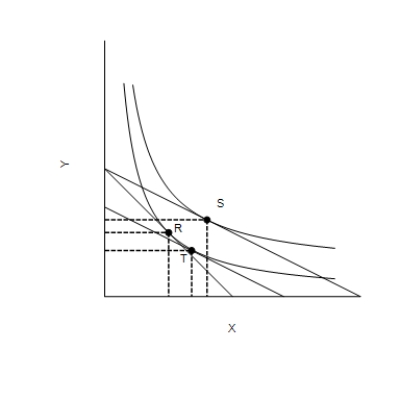 -Refer to Figure 21-12. Suppose that a consumer is originally at point R. Then the price of good X decreases. Which of the following represents the substitution effect of the price decrease?
(Multiple Choice)
4.8/5 (42)
Figure 21-3
In each case, the budget constraint moves from BC1 to BC2.
Graph (a)
Graph (b)
Graph (c)
Graph (d) 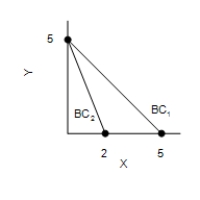
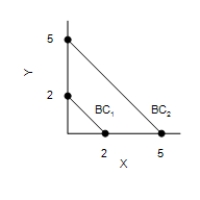
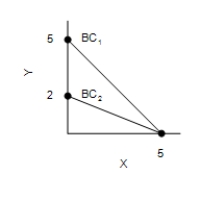
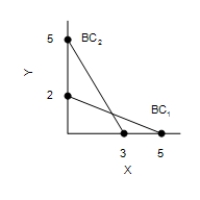 -Refer to Figure 21-3. Which of the graphs in the figure could reflect an increase in income?
(Multiple Choice)
4.8/5 (25)
Table 21-3
Ethan consumes two goods, milk and pretzels. Milk costs $2 per glass, and he consumes it to the point where the marginal utility he receives from his last glass of milk is 6. Pretzels cost $4 per bag. The relationship between the marginal utility Ethan gets from eating a bag of pretzels and the number of bags he eats per month is as follows:
Bags of Pretzels Marginal Utility 1 30 2 20 3 12 4 6 5 2 6 0
-Refer to Table 21-3. If Ethan is maximizing his utility, how many bags of pretzels does he buy each month?
(Multiple Choice)
4.9/5 (41)
Figure 21-19
The figure shows three indifference curves and a budget constraint for a consumer named Hannah. When young, Hannah works and earns income. When old, she is retired and earns no income.
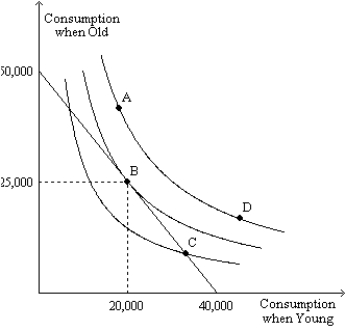
-Refer to Figure 21-19. From the figure we can determine how much income Hannah earns when young and we can determine the interest rate. Could the interest rate rise to a level at which Hannah could afford to be at point D?
-Refer to Figure 21-19. From the figure we can determine how much income Hannah earns when young and we can determine the interest rate. Could the interest rate rise to a level at which Hannah could afford to be at point D?
(Essay)
4.9/5 (37)
Figure 21-9
Graph (a)
Graph (b)
Graph (c) 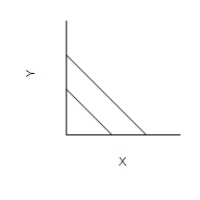
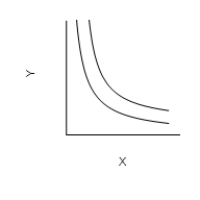
-Refer to Figure 21-9. Which of the graphs illustrates indifference curves for which the marginal rate of substitution varies?
-Refer to Figure 21-9. Which of the graphs illustrates indifference curves for which the marginal rate of substitution varies?
(Multiple Choice)
4.8/5 (39)
Consumer will always consume more of a good if their income increases.
(True/False)
4.8/5 (45)
"Left" gloves and "right" gloves provide a good example of
(Multiple Choice)
4.9/5 (39)
Suppose an individual knows that the marginal utility he receives from the next apple is 5 and that the price of an apple is $2. He also knows that the marginal utility he receives from the next orange is 3 and the price of an orange is $1. If the individual is choosing optimally, the next good he will buy is
(Multiple Choice)
4.9/5 (26)
Liana consumes only beer and chips. Her indifference curves are all bowed inward. Consider the bundles (2,6), (4,4), and (6,2). If Liana is indifferent between (2,6) and (6,2), then Liana must
(Multiple Choice)
4.9/5 (43)
A consumer's budget constraint is drawn on a graph with the number of sandwiches measured along the horizontal axis and the number of bowls of soup measured along the vertical axis. Hold the consumer's income and the price of a sandwich fixed, and increase the price of a bowl of soup. Describe the effect on the budget constraint.
(Essay)
4.8/5 (43)
Figure 21-7
The following graph shows three possible indifference curves (I) for a consumer. 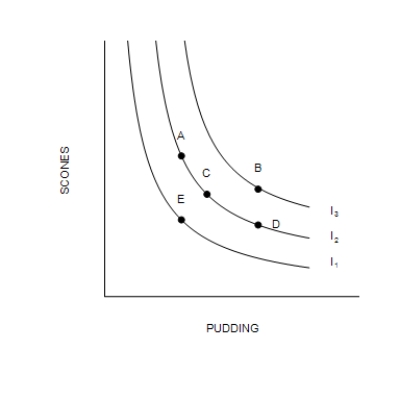
-Refer to Figure 21-7. When comparing bundle A to bundle C, the consumer
-Refer to Figure 21-7. When comparing bundle A to bundle C, the consumer
(Multiple Choice)
4.7/5 (30)
Figure 21-12
-Refer to Figure 21-12. Suppose that a consumer is originally at point R. Then the price of good X decreases. Which of the following represents the income effect of the price decrease?
(Multiple Choice)
4.8/5 (39)
Filters
- Essay(0)
- Multiple Choice(0)
- Short Answer(0)
- True False(0)
- Matching(0)