Exam 3: Numerical Summaries of Data
Exam 1: Basic Ideas32 Questions
Exam 2: Graphical Summaries of Data34 Questions
Exam 3: Numerical Summaries of Data62 Questions
Exam 4: Probability30 Questions
Exam 5: Discrete Probability Distributions83 Questions
Exam 6: The Normal Distribution52 Questions
Exam 7: Confidence Intervals65 Questions
Exam 8: Hypothesis Testing46 Questions
Exam 9: Inferences on Two Samples86 Questions
Exam 10: Tests With Qualitative Data33 Questions
Exam 11: Correlation and Regression39 Questions
Exam 12: Statistical Analysis Questions in ANOVA and Rank-Sum Test140 Questions
Select questions type
Following are heights, in inches, for a sample of college basketball players
76 82 83 83 80 83 81 76 78 81 82 82 79 80 77 80 79 76 76 81
Find the mean height of the basketball players
Free
(Multiple Choice)
4.8/5  (39)
(39)
Correct Answer: Verified
D
Approximate the population variance given the following frequency distribution.
Class Frequency 0-19 19 20-39 11 40-59 13 60-79 15 80-99 19
Free
(Multiple Choice)
4.8/5 (41)
Correct Answer:Verified
A
A data set contains three unique values. Which of the following must be true?
Free
(Multiple Choice)
4.8/5 (39)
Correct Answer:Verified
D
A data set has a median of 43, and four of the numbers in the data set are less than median. The data set contains a total of n numbers. If n is even, and none of the numbers in the data set are equal to 43, what is the value of n?
(Multiple Choice)
4.8/5 (37)
Find the median for the following data set:
34 30 25 15 20 20
(Multiple Choice)
4.9/5 (37)
For the data set below, list the outliers, if any.
38 42 44 38 45 42 60 42 48 40 56 61 65 52 20 92 47 61 30 7
(Multiple Choice)
4.9/5 (32)
Find the population standard deviation for the following data set:
21 12 20 15 18
(Multiple Choice)
4.9/5 (43)
The following table presents the heights (in inches) of a sample of college basketball play.
Height (in.) Frequency 68-71 18 72-75 49 76-79 66 80-83 48 84-87 10
Considering the data to be a population, approximate the standard deviation of the heights.
(Multiple Choice)
4.8/5 (41)
A population has a mean and standard deviation Find the z -score for a population value of 29 .
(Multiple Choice)
4.9/5 (35)
The table below lists the populations, in thousands, of several rural western counties. What is the median population?
County Population (thousands) Aldridge 13 Cleveland 10 McCarthy 16 Pope 20 Sorrell 15 Wilson 25
(Multiple Choice)
4.9/5 (39)
Find the mean of the data in the following stem-and-leaf plot. The leaf represents the ones digit.
1 2288 2 018 3 58 4 6
(Multiple Choice)
4.8/5 (37)
Gina and Stewart are surf-fishing on the Atlantic coast, where both bluefish and pompano are common catches. The mean length of a bluefish is 261 millimeters with a standard deviation of 45 mm. For pompano, the mean is 156 mm with a standard deviation of 24 mm.
Stewart caught a bluefish that was 286 mm long, and Gina caught a pompano that was 181 mm long. Who caught the longer fish, relative to fish of the same species?
(Multiple Choice)
4.9/5 (46)
For the data set below, find the 30th percentile.
64 95 74 70 32 58 24 46 25 17 59 51 7 60 36 67 67 54 33 60
(Multiple Choice)
4.8/5 (51)
Find the mean for the following data set:
27 15 25 31 35 25
(Multiple Choice)
4.9/5 (41)
A student has an average of 88 on seven chapter tests. If the student's scores on six of the tests are 91, 91, 92, 82, 91, and 70, what was the score on the remaining test?
(Multiple Choice)
4.8/5 (40)
Gina and Stewart are surf-fishing on the Atlantic coast, where both bluefish and pompano are common catches. The mean length of a bluefish is 288 millimeters with a standard deviation of 51 mm. For pompano, the mean is 129 mm with a standard
deviation of 40 mm. Stewart caught a bluefish that was 321 mm long. What was the z-score for this length?
(Multiple Choice)
4.8/5 (31)
The completion times for a certain marathon race was 2.9 hours with a standard deviation of 0.5 hours. What can you determine about these data by using Chebyshev's Inequality with K = 3?
(Multiple Choice)
4.7/5 (39)
For the data shown in the histogram, which of the following choices best describes the relationship between the median and the mean?
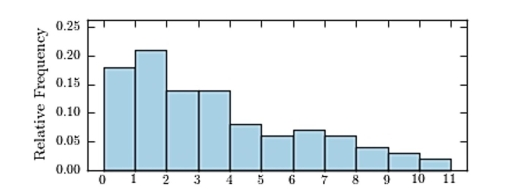
(Multiple Choice)
4.8/5 (36)
A consumer advocacy group tested the "on-air" lifetimes of a random sample of 162 cell phone batteries. The mean lifetime was 2.9 hours with a standard deviation of 0.4 hours. The lifetimes are approximately bell-shaped. Estimate the number of batteries with lifetimes between 2.1 hours and 3.7 hours.
(Multiple Choice)
5.0/5 (39)
Filters
- Essay(0)
- Multiple Choice(0)
- Short Answer(0)
- True False(0)
- Matching(0)