Exam 3: Numerical Summaries of Data
Exam 1: Basic Ideas32 Questions
Exam 2: Graphical Summaries of Data34 Questions
Exam 3: Numerical Summaries of Data62 Questions
Exam 4: Probability30 Questions
Exam 5: Discrete Probability Distributions83 Questions
Exam 6: The Normal Distribution52 Questions
Exam 7: Confidence Intervals65 Questions
Exam 8: Hypothesis Testing46 Questions
Exam 9: Inferences on Two Samples86 Questions
Exam 10: Tests With Qualitative Data33 Questions
Exam 11: Correlation and Regression39 Questions
Exam 12: Statistical Analysis Questions in ANOVA and Rank-Sum Test140 Questions
Select questions type
The following data represent the total price, in dollars, of 20 randomly-selected gasoline purchases at a certain convenience store.
42.77 66.31 48.83 64.59 73.18 66.83 72.93 75.45 71.09 45.93 61.29 61.15 43.27 49.44 60.34 62.71 79.05 41.02 11.48 69.98\
Which value in this data set is most accurately described as an extreme value?
(Multiple Choice)
4.7/5  (42)
(42)
The following data represent the ice cream flavor choices of 20 diners at a college cafeteria.
Moose Tracks Rocky Road Vanilla Moose Tracks Choc. Chip Chocolate Moose Tracks Chocolate Rocky Road Rocky Road Moose Tracks Rocky Road Rocky Road Vanilla Moose Tracks Vanilla Vanilla Moose Tracks Choc. Chip Moose Tracks
Which flavor ice cream is the mode?
(Multiple Choice)
4.8/5 (34)
Approximate the sample variance given the following frequency distribution.
Class Frequency 0-9 11 10-19 10 20-29 18 30-39 15 40-49 13
(Multiple Choice)
4.7/5 (44)
The table below lists the populations, in thousands, of several rural western counties. What is the mean population?
County Population (thousands) Aldridge 15 Cleveland 23 McCarthy 11 Pope 18 Sorrell 14 Wilson 8
(Multiple Choice)
4.7/5 (27)
The following data represent the total price, in dollars, of 20 randomly-selected gasoline purchases at a certain convenience store.
37.43 35.64 40.49 38.41 32.38 39.27 40.79 42.89 33.94 13.69 48.73 49.03 34.75 47.04 34.61 40.11 43.52 45.16 11.63 26.90
Find the mean price for these purchases.
(Multiple Choice)
4.7/5 (39)
A soft-drink bottling company fills and ships soda in plastic bottles with a target volume of 354 milliliters. The filling machinery does not deliver a perfectly consistent volume of liquid to each bottle, and the three quartiles for the fill volume are and
A fill volume of 353 mL is considered low. Would a fill volume of 353 mL be considered an outlier?
(True/False)
4.8/5 (39)
For the data set below, find the IQR.
63 74 69 69 65 67 77 60 79 65 73
(Multiple Choice)
4.8/5 (22)
The following table presents the heights (in inches) of a sample of college basketball play.
Height (in.) Frequency 68-71 2 72-75 2 76-79 2 80-83 2 84-87 1
Considering the data to be a population, approximate the variance of the heights.
(Multiple Choice)
4.8/5 (30)
Following are the closing prices (in dollars) of a certain stock for the past 20 trading days.
 Find the population standard deviation for the closing prices.
(Multiple Choice)
4.7/5 (32)
A data set has a mean of 60 and a standard deviation of 5. Which of the following might possibly be true?
(Multiple Choice)
4.8/5 (38)
A paint manufacturer discovers that the mean volume of paint in a gallon-sized pail is 1 gallon with a standard deviation of 0.05 gallons. The paint volumes are approximately bell-shaped. Estimate the percent of pails with volumes between 0.90 gallons and 1.10 gallons.
(Multiple Choice)
4.8/5 (39)
The following population parameters were obtained from a graphing calculator.
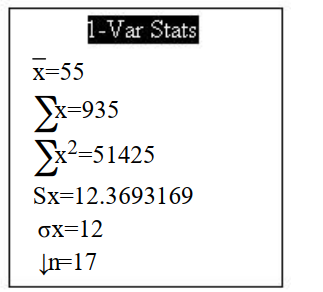 Assuming the population is bell-shaped, approximately what percentage of the population values are between 43 and 67?
(Multiple Choice)
4.8/5 (36)
Approximate the population standard deviation given the following frequency distribution.
Class Frequency 0-19 10 20-39 14 40-59 12 60-79 11 80-99 8
(Multiple Choice)
4.9/5 (43)
Approximate the sample standard deviation given the following frequency distribution.
Class Frequency 0-19 10 20-39 18 40-59 17 60-79 15 80-99 10
(Multiple Choice)
4.9/5 (42)
For the data set below, find the third quartile.
72 72 67 68 75 73 73 70 65 79 79
(Multiple Choice)
4.8/5 (39)
Find the mode of the data in the following stem-and-leaf plot. The leaf represents the ones digit.
0 157 1 03448 2 68
(Multiple Choice)
4.8/5 (42)
A data set has a median of 41, and four of the numbers in the data set are less than median. The data set contains a total of n numbers. If n is odd, and exactly one number in the data set is equal to 41, what is the value of n?
(Multiple Choice)
4.8/5 (35)
For the data set below, find the outlier(s)
166 169 170 161 155 206 152 167 204 134 165
(Multiple Choice)
4.9/5 (38)
Filters
- Essay(0)
- Multiple Choice(0)
- Short Answer(0)
- True False(0)
- Matching(0)