Exam 3: Numerical Summaries of Data
Exam 1: Basic Ideas32 Questions
Exam 2: Graphical Summaries of Data34 Questions
Exam 3: Numerical Summaries of Data62 Questions
Exam 4: Probability30 Questions
Exam 5: Discrete Probability Distributions83 Questions
Exam 6: The Normal Distribution52 Questions
Exam 7: Confidence Intervals65 Questions
Exam 8: Hypothesis Testing46 Questions
Exam 9: Inferences on Two Samples86 Questions
Exam 10: Tests With Qualitative Data33 Questions
Exam 11: Correlation and Regression39 Questions
Exam 12: Statistical Analysis Questions in ANOVA and Rank-Sum Test140 Questions
Select questions type
Use the given frequency distribution to approximate the mean.
Class Frequency 0-9 8 10-19 18 20-29 12 30-39 11 40-49 17
(Multiple Choice)
4.8/5  (39)
(39)
A population has a mean and standard deviation What number has a z -score of -0.5 ?
(Multiple Choice)
4.9/5 (30)
The following data represent the total price, in dollars, of 20 randomly-selected gasoline purchases at a certain convenience store.
21.65 32.07 39.46 42.22 14.00 43.02 47.81 41.60 11.99 42.34 16.40 44.80 30.04 45.22 42.16 49.39 29.51 33.42 43.97 46.61
Find the median price for these purchases.
(Multiple Choice)
4.7/5 (35)
Find the population variance for the following data set:
13 23 26 17 21
(Multiple Choice)
4.8/5 (32)
A soft-drink bottling company fills and ships soda in plastic bottles with a target volume of 354 milliliters. The filling machinery does not deliver a perfectly consistent volume of liquid to each bottle, and the three quartiles for the fill volume are and
Find the IQR.
(Multiple Choice)
4.8/5 (42)
The following population parameters were obtained from a graphing calculator.
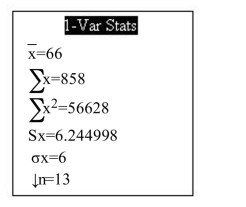 Assuming the population is bell-shaped, between what two values will approximately 68% of the population be?
(Multiple Choice)
4.8/5 (42)
A data set has a mean of 129 and a standard deviation of 24. Compute the coefficient of variation.
(Multiple Choice)
4.7/5 (34)
Find the sample standard deviation for the following data set:
25 23 17 16 30
(Multiple Choice)
4.8/5 (37)
For the data set below, find the first quartile.
76 63 61 66 69 68 77 72 69 63 79
(Multiple Choice)
4.9/5 (33)
Find the mode for the following data set:
21 27 30 21 29 14
(Multiple Choice)
4.8/5 (34)
A report states that the mean household income last year for a certain rural county was $46,200 and the median was $54,500. If a histogram were constructed for the incomes of all households in the county, would you expect it to be skewed to the right, to the left, or approximately symmetric?
(Multiple Choice)
4.9/5 (30)
For which of the following histograms is it appropriate to use the Empirical Rule?
(Multiple Choice)
4.8/5 (43)
Construct a boxplot for the data set below.
94 96 89 90 90 89 88 85 85 88 92 91 91 90 90 90 93 89 82 84
(Multiple Choice)
4.9/5 (43)
Find the sample variance for the following data set:
22 12 23 17 21
(Multiple Choice)
4.8/5 (43)
Find the median of the data in the following stem-and-leaf plot. The leaf represents the ones digit.
1 2577899 2 3 1 4 67
(Multiple Choice)
4.9/5 (32)
For the data set below, find the upper outlier boundary.
160 176 193 144 163 146 152 158 154 184 129
(Multiple Choice)
4.8/5 (35)
Find the median for the following data set:
32 24 29 19 13 22
(Multiple Choice)
4.7/5 (37)
Filters
- Essay(0)
- Multiple Choice(0)
- Short Answer(0)
- True False(0)
- Matching(0)