Exam 11: Correlation and Regression
Exam 1: Basic Ideas32 Questions
Exam 2: Graphical Summaries of Data34 Questions
Exam 3: Numerical Summaries of Data62 Questions
Exam 4: Probability30 Questions
Exam 5: Discrete Probability Distributions83 Questions
Exam 6: The Normal Distribution52 Questions
Exam 7: Confidence Intervals65 Questions
Exam 8: Hypothesis Testing46 Questions
Exam 9: Inferences on Two Samples86 Questions
Exam 10: Tests With Qualitative Data33 Questions
Exam 11: Correlation and Regression39 Questions
Exam 12: Statistical Analysis Questions in ANOVA and Rank-Sum Test140 Questions
Select questions type
In an experiment to determine whether there is a systematic difference between the weights obtained with two different mass balances, six specimens were weighed, in grams, on each balance. The following data were obtained:
Specimen 1 13.05 13.07 2 6.38 6.40 3 5.00 4.95 4 13.33 13.29 5 10.56 10.55 6 12.92 12.92
State the null and alternate hypotheses.
Free
(Multiple Choice)
4.9/5  (39)
(39)
Correct Answer: Verified
C
The following display from a TI-84 Plus calculator presents the results of a hypothesis test for the difference between two proportions. The sample sizes are and
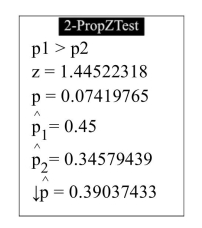 Can you reject rejected at the level?
Free
(True/False)
4.8/5 (37)
Correct Answer:Verified
False
The following display from a TI-84 Plus calculator presents the results of a hypothesis test for the difference between two proportions. The sample sizes are and
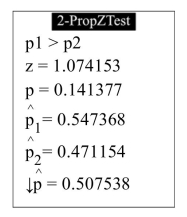 What is the P -value?
Free
(Multiple Choice)
4.8/5 (41)
Correct Answer:Verified
A
The football coach at State University wishes to determine if there is a decrease in offensive production between the first half and the second half of his team's recent games. The table below shows the first-half and second-half offensive production (measured in total yards gained per half) for the past six games.
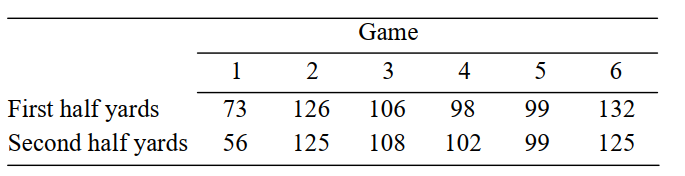 Can you conclude that the mean offensive production in the first half differed from that of
the second half?
i). State the null and alternative hypotheses.
ii). Compute the test statistic.
iii). State a conclusion using the α = 0.10 level of significance.
Can you conclude that the mean offensive production in the first half differed from that of
the second half?
i). State the null and alternative hypotheses.
ii). Compute the test statistic.
iii). State a conclusion using the α = 0.10 level of significance.
(Essay)
4.8/5 (28)
The following MINITAB output display presents the results of a hypothesis test on the difference between two proportions.
Test and CI for Two Proportions: P1, P2
Variable Sample P P1 43 107 0.40186916 P2 36 95 0.37894737
Difference
Estimate for differencę.02292179
CI for difference:(-0.11191015, 0.15775373)
T-Test of difference vs not P-Value
Can you reject rejected at the level?
(True/False)
4.7/5 (42)
A study reported that in a sample of 104 people who watch television news, 35 had elevated diastolic blood pressure levels (in millimeters of mercury, or mmHg). In a sample of 74 people who do not watch television news, 20 had elevated diastolic blood pressure levels.
Can you conclude that the proportion of people with elevated diastolic blood pressure levels differs between news-watchers and those who do not watch news? Use the level significance.
(True/False)
4.9/5 (38)
The concentration of hexane (a common solvent) was measured in units of micrograms per liter for a simple random sample of nineteen specimens of untreated ground water taken near a municipal landfill. The sample mean was 508.4 with a sample standard deviation of 4.3. Sixteen specimens of treated ground water had an average hexane concentration of 506.1 with a standard deviation of 4.7. It is reasonable to assume that both samples come from populations that are approximately normal. Can you conclude that the mean hexane concentration is less in treated water than in untreated water? Use the level of significance.
(True/False)
5.0/5 (40)
The following MINITAB output display presents the results of a hypothesis test on the difference between two proportions.
Test and CI for Two Proportions: P1, P2
Variable Sample P P1 47 88 0.534091 P2 44 89 0.494382
Difference
Estimate for difference9.039709
CI for difference:(-0.107557, 0.186975)
T-Test of difference vs not P-Value What is the P-value?
(Multiple Choice)
4.8/5 (37)
Following is a sample of five matched pairs.
Sample 1 18 26 20 20 20 Sample 2 17 20 18 19 18
Let and represent the population means and let . A test will be made of the hypotheses versus . Can you reject at the level of significance?
(True/False)
4.8/5 (47)
An F-test with 13 degrees of freedom in the numerator and 9 degrees of freedom in the denominator produced a test statistic whose value was 3.36. The null and alternate hypotheses were
Do you reject at the level?
(True/False)
4.8/5 (33)
The following MINITAB output display presents the results of a hypothesis test for the difference between two population means.
Two-sample T for X1 vs X2 N Mean StDev SE Mean A 7 145.411 24.669 9.324 B 14 132.964 25.604 6.843
Difference
Estimate for difference:
CI for difference:
Test of difference vs not T-Value
Value
What is the alternate hypothesis?
(Multiple Choice)
4.8/5 (37)
In an experiment to determine whether there is a systematic difference between the weights obtained with two different mass balances, six specimens were weighed, in grams, on each balance. The following data were obtained:
Specimen 1 7.97 7.95 2 10.27 10.25 3 6.70 6.70 4 10.22 10.21 5 7.89 7.88 6 5.10 5.07
State a conclusion using the level of significance.
(Multiple Choice)
4.8/5 (37)
A broth used to manufacture a pharmaceutical product has its sugar content, in milligrams per milliliter, measured several times on two successive days.The results are shown below.
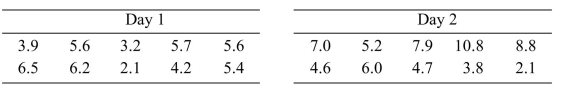 Can you conclude that the variability of the process is greater on the second day than on tl day? Use the level of significance.
(True/False)
4.7/5 (41)
The following display from a TI-84 Plus calculator presents the results of a hypothesistest for the difference between two means. The sample sizes are
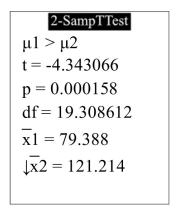 How many degrees of freedom did the calculator use?
(Multiple Choice)
4.8/5 (33)
The following display from a TI-84 Plus calculator presents the results of a hypothesis test for the difference between two proportions. The sample sizes are and
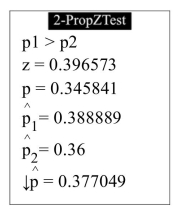 Is this a left-tailed test, a right-tailed test, or a two-tailed test?
(Multiple Choice)
4.9/5 (28)
A test was made of
The sample means were and the sample standard deviations were and the sample sizes were
Is rejected at the 0.05 level? (Hint: First compute the value of the test statistic.)
(True/False)
4.9/5 (37)
Five null hypotheses were tested, and the P-values were:
Hypothesis 1 2 3 4 5 P-value 0.022 0.003 0.018 0.015 0.012
Which hypotheses, if any, can be rejected at the level?
(Multiple Choice)
4.9/5 (49)
The football coach at State University wishes to determine if there is a change in offensive production between the first half and the second half of his team's recent games. The table below shows the first-half and second-half offensive production (measured in total yards gained per half) for the past six games.
Game 1 2 3 4 5 6 First half yards 123 136 130 134 95 93 Second half yards 103 120 116 143 62 60
State the null and alternative hypotheses.
(Multiple Choice)
4.9/5 (37)
The following display from a TI-84 Plus calculator presents the results of a hypothesis test for the difference between two means. The sample sizes are
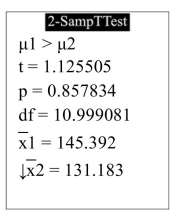 What is the P -value?
(Multiple Choice)
4.8/5 (39)
Filters
- Essay(0)
- Multiple Choice(0)
- Short Answer(0)
- True False(0)
- Matching(0)