Exam 5: Exponents and Polynomials
Exam 1: Variables, Real Numbers, and Mathematical Models147 Questions
Exam 2: Linear Equations and Inequalities in One Variable181 Questions
Exam 3: Linear Equations in Two Variables121 Questions
Exam 4: Systems of Linear Equations118 Questions
Exam 5: Exponents and Polynomials122 Questions
Exam 6: Factoring Polynomials118 Questions
Exam 7: Rational Expressions135 Questions
Exam 8: Basics of Functions90 Questions
Exam 9: Inequalities and Problem Solving93 Questions
Exam 10: Radicals, Radical Functions, and Rational Exponents102 Questions
Select questions type
Perform the indicated operations.
-The bar graph shows the median annual income for residents of a selected region of the United States, by level of education. The given polynomial models describe the median annual income for men, M, and for women, W, who have
Completed x years of education. M=-23+1170-13,808x+72,566 W=8-56+511x+14,763 Find a mathematical model for M - W and use it to calculate the difference in the median annual income between
Men and women with 10 years of education. Does the model underestimate or overestimate the actual
Difference? 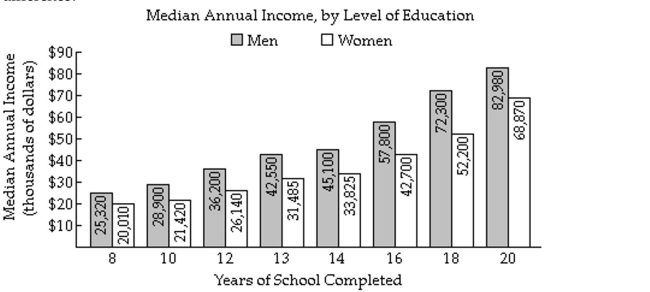
(Multiple Choice)
4.9/5  (40)
(40)
Use a vertical format to subtract the polynomials.
- 9+5+3y - 2-18+9y
(Multiple Choice)
4.8/5 (40)
Graph the equation. Find seven solutions in your table of values for the equation by using integers for x, starting with -3
and ending with 3.
-
x 4- -3 -2 -1 0 1 2 3
(Multiple Choice)
4.9/5 (33)
Use the FOIL method to find the product. Express the product in descending powers of the variable.
-
(Multiple Choice)
4.7/5 (41)
Evaluate the polynomial for the given values of x and y.
- and
(Multiple Choice)
4.8/5 (33)
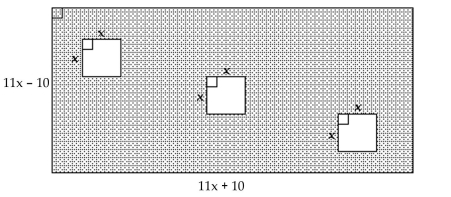
Find the area of the shaded region. Write the answer as a polynomial in descending powers of x.
-
(Multiple Choice)
4.8/5 (34)
Use the FOIL method to find the product. Express the product in descending powers of the variable.
-
(Multiple Choice)
4.8/5 (32)
Use the FOIL method to find the product. Express the product in descending powers of the variable.
-
(Multiple Choice)
4.8/5 (39)
Graph the equation. Find seven solutions in your table of values for the equation by using integers for x, starting with -3
and ending with 3.
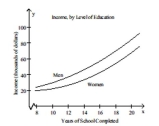
-A census was taken to determine the median annual income for residents of a selected region of the United States, by level of education. The given polynomial models describe the median annual income for men, M, and
For women, W, who have completed x years of education. Shown in a rectangular coordinate system are the
Graphs of the polynomial models. Identify the median annual income for a woman with 13 years of education as
A point on the appropriate graph. M=224-1266x+20,106 W=287-4030x+33,761
(Multiple Choice)
4.9/5 (40)
Filters
- Essay(0)
- Multiple Choice(0)
- Short Answer(0)
- True False(0)
- Matching(0)