Exam 1: Functions, Graphs, and Models; Linear Functions
Exam 1: Functions, Graphs, and Models; Linear Functions306 Questions
Exam 2: Linear Models, Equations, and Inequalities212 Questions
Exam 3: Quadratic, Piecewise-Defined, and Power Functions261 Questions
Exam 4: Additional Topics With Functions299 Questions
Exam 5: Exponential and Logarithmic Functions304 Questions
Exam 6: Higher-Degree Polynomial and Rational Functions262 Questions
Exam 7: Systems of Equations and Matrices196 Questions
Exam 8: Special Topics in Algebra265 Questions
Select questions type
Crafty Bill's Cool Car Sales opened as a used car sales lot in 2006. The graph shows the number of cars sold as a function of time. What is the domain of this function if we consider only the indicated points? 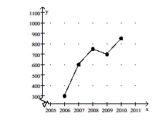
(Multiple Choice)
4.9/5  (30)
(30)
Suppose a cost-benefit model is given by , where C is the cost in thousands of dollars for removing p percent of a given pollutant. Find C(90) to the nearest dollar and interpret it.
(Multiple Choice)
4.9/5 (30)
The cost of a rental car for the weekend is given by the function C(x) , where x is the number of miles driven. Find the slope of the graph of this function and interpret it as a rate of change.
(Multiple Choice)
4.9/5 (36)
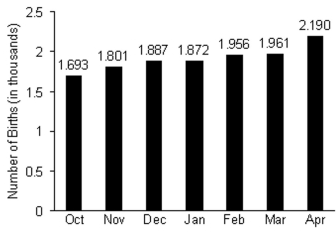
The number of births in a certain state has been increasing in recent months. Using the information given on the bar graph for the months October to April, find an equation to model the number of births y for the month x . Let x=0 correspond to October and x=6 correspond to April. Use these two points to find the equation.
(Multiple Choice)
4.8/5 (44)
The population of rabbits varies with the season due to migration, birth and death. The number, N, of rabbits during month x on a certain midwestern farm can be estimated with the following graph. 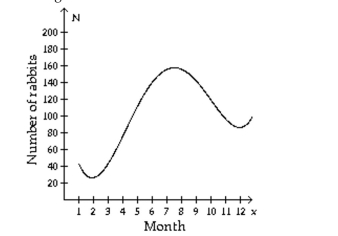 1=January, 2=February, and so on. What month has the least number of rabbits?
(Multiple Choice)
4.8/5 (35)
Determine whether or not the relationship shown in the table is a function.
- x y 5 12 7 3 5 7 4 5 Does the table define y as a function of x?
(Multiple Choice)
4.8/5 (33)
Assume that the sales of a certain appliance dealer are approximated by a linear function. Suppose that sales were $7500 in 2007 and $56,500 in 2012. Let x = 0 represent 2007. Find the equation giving yearly sales y.
(Multiple Choice)
4.7/5 (39)
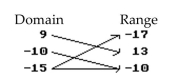
Decide whether or not the arrow diagram defines a function.
-
(Multiple Choice)
4.9/5 (36)
In a certain town the annual consumption, b, of beef (in pounds per person) can be estimated by where t is the number of years since 2010. Find and interpret the b-intercept of the graph of this function.
(Multiple Choice)
4.9/5 (41)
The population of rabbits varies with the season due to migration, birth and death. The number, N, of rabbits during month x on a certain midwestern farm can be estimated with the following graph. 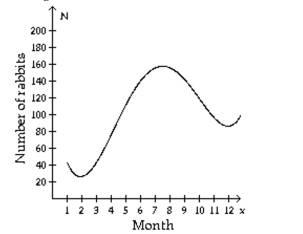 1=January, 2=February, and so on. During which months are there approximately 140 rabbits on the farm?
(Multiple Choice)
4.8/5 (38)
Graph the scatter plot of the data.
- 5 -2 -2 -3 5 -1 -5 9 -4 -2 -6 -4 2 -6 2 3 -6 4 -2 -5
(Multiple Choice)
4.7/5 (30)
A gas station sells 4820 gallons of regular unleaded gasoline in a day when they charge $1.35 per gallon, whereas they sell 3895 gallons on a day that they charge $1.40 per gallon. Find a linear function that expresses
Gallons sold as a function of price. Use this function to predict the number of gallons sold at a price of $1.28 per
Gallon.
(Multiple Choice)
4.8/5 (37)
Find the slope of the line through the pair of points.
- and
(Multiple Choice)
4.9/5 (31)
Use a graphing utility to graph the function and then answer the question.
-John owns a hotdog stand. He has found that his profit is represented by the equation , with P being profits and x the number of hotdogs. How many hotdogs must he sell to earn the most profit?
(Multiple Choice)
4.9/5 (45)
Decide whether the slope is positive, negative, zero, or undefined.
-
(Multiple Choice)
4.8/5 (36)
Write an equation of the line through the given point with the given slope. Write the equation in slope-intercept form.
-
(Multiple Choice)
4.8/5 (41)
Determine whether or not the function is linear. If it is, determine the slope and interpret it.
-The cost of tuition at a community college is given x, where x is the number of credit hours. Find and interpret the C-intercept of the graph of this function.
(Multiple Choice)
4.9/5 (32)
Filters
- Essay(0)
- Multiple Choice(0)
- Short Answer(0)
- True False(0)
- Matching(0)