Exam 1: Functions, Graphs, and Models; Linear Functions
Exam 1: Functions, Graphs, and Models; Linear Functions306 Questions
Exam 2: Linear Models, Equations, and Inequalities212 Questions
Exam 3: Quadratic, Piecewise-Defined, and Power Functions261 Questions
Exam 4: Additional Topics With Functions299 Questions
Exam 5: Exponential and Logarithmic Functions304 Questions
Exam 6: Higher-Degree Polynomial and Rational Functions262 Questions
Exam 7: Systems of Equations and Matrices196 Questions
Exam 8: Special Topics in Algebra265 Questions
Select questions type
Graph the scatter plot of the data.
- x -3 3 8 9 7 6 2 -1 1 y 3 9 11 11 9 9 6 4 3
(Multiple Choice)
4.9/5  (30)
(30)
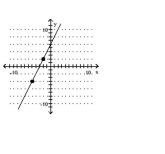
Find the slope of the line (if it exists) and the y-intercept (if it exists).
-
(Multiple Choice)
4.8/5 (34)
Decide whether the slope is positive, negative, zero, or undefined.
-
(Multiple Choice)
5.0/5 (32)
The grade point average, G , of students at a community college is shown by age, x , in the table below. Use the lir connecting the points (18,2.5) and (26,3.2) to find a linear model for this data.
Age (years) 18 23 20 26 29 16 25 20 32 Grade Point Average 2.5 3.0 2.7 3.2 3.9 2.0 3.5 3.1 3.6
(Multiple Choice)
4.7/5 (39)
The polynomial gives the predicted sales volume of a company, in millions of items, where x is the number of years from now. Determine the predicted sales 18 years from now.
Round your answer to the nearest hundredth million.
(Multiple Choice)
5.0/5 (35)
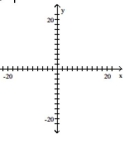
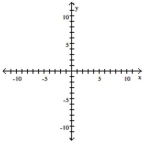
Find the x- and y-intercepts of the graph of the given equation, if they exist. Then graph the equation.
-
(Multiple Choice)
4.8/5 (31)
Find the slope of the line (if it exists) and the y-intercept (if it exists).
-
(Multiple Choice)
4.8/5 (39)
A customer's savings account number n given the number of years y the account has been active.
(Multiple Choice)
4.9/5 (40)
Write the slope-intercept form of the equation for the line passing through the given pair of points.
- and
(Multiple Choice)
4.8/5 (30)
Suppose that the speed of a car, measured in miles per hour (mph), is monitored for some short period of time after the driver applies the brakes. The following table and graph relate the speed of the car to the amount of
Time, measured in seconds (sec), elapsed from the moment that the brakes are applied. ELAPSED TIME (sec) 2 4 6 8 10 SPEED of CAR (mph) 47 32 22 12 7
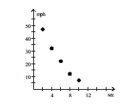 What general trend do the data reflect? In which of the time intervals does the speed change the most?
(Multiple Choice)
4.9/5 (33)
Determine whether the given relationship defines a function. If so, identify the independent and dependent variable, and
why the relationship is a function.
-The balance b in a checking account on a given day x.
(Multiple Choice)
4.7/5 (33)
Write the equation of the line with the given conditions.
-passing through and parallel to the line with equation
(Multiple Choice)
4.8/5 (33)
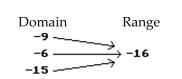
Decide whether or not the arrow diagram defines a function.
-
(Multiple Choice)
4.8/5 (36)
Suppose the monthly total revenue for manufacturing baseball bats is R(x) = 26.00x, where x is the number of bats sold each month. Find and interpret the marginal revenue for the product.
(Multiple Choice)
4.8/5 (43)
Give a definition or an example of the word or phrase: Perpendicular lines
(Essay)
4.9/5 (41)
Write the slope-intercept form of the equation for the line passing through the given pair of points.
- and
(Multiple Choice)
5.0/5 (31)
Filters
- Essay(0)
- Multiple Choice(0)
- Short Answer(0)
- True False(0)
- Matching(0)