Exam 1: Functions, Graphs, and Models; Linear Functions
Exam 1: Functions, Graphs, and Models; Linear Functions306 Questions
Exam 2: Linear Models, Equations, and Inequalities212 Questions
Exam 3: Quadratic, Piecewise-Defined, and Power Functions261 Questions
Exam 4: Additional Topics With Functions299 Questions
Exam 5: Exponential and Logarithmic Functions304 Questions
Exam 6: Higher-Degree Polynomial and Rational Functions262 Questions
Exam 7: Systems of Equations and Matrices196 Questions
Exam 8: Special Topics in Algebra265 Questions
Select questions type
Decide whether or not the set of ordered pairs defines a function.
-
(Multiple Choice)
4.9/5  (26)
(26)
Decide whether or not the equation defines y as a function of x.
-
(Multiple Choice)
4.8/5 (41)
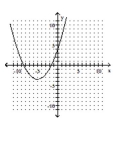
Find the x- and y-intercepts of the graph of the given equation, if they exist. Then graph the equation.
-
(Multiple Choice)
4.8/5 (38)
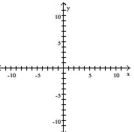
State whether the graph is or is not that of a function.
-
(Multiple Choice)
4.9/5 (37)
Employees of a publishing company received an increase in salary of 7% plus a bonus of $700. Let S(x) = 1.07x + 700 represent the new salary in terms of the previous salary x. Find and interpret S(13,000).
(Multiple Choice)
4.8/5 (25)
Determine whether or not the relationship shown in the table is a function.
- January 1 2 3 4 5 6 7 Weight (lbs) 197 196 198 197 196 195 194 Does the table define weight as a function of the day in January?
(Multiple Choice)
4.8/5 (35)
This chart shows the fees for an 18-hole round of golf for each of the last 5 years at a local municipal golf course. Assume that this chart defines a function with the name of f. Find the value of x when Year Fee 2008 \ 20 2009 \ 23 2010 \ 25 2011 \ 25 2012 \ 30
(Multiple Choice)
4.7/5 (40)
Decide whether or not the set of ordered pairs defines a function.
-
(Multiple Choice)
4.7/5 (37)
Determine whether or not the relationship shown in the table is a function.
- Number of Classes Missed 1 2 3 4 5 6 7 Average Final Exam Score 80 78 81 74 73 70 65 Does the table define the number of classes missed as a function of the average final exam score?
(Multiple Choice)
4.8/5 (32)
The cost of tuition at a community college is given x, where x is the number of credit hours. Interpret the slope of this function as a rate of change.
(Multiple Choice)
4.9/5 (33)
. Use the slope and either of the two points in the
point-slope form of the equation.
-The total number of reported cases of AIDS in the United States has risen from 372 in 2001 to 100,000 in 2009
and 200,000 in 2012. Does a linear equation fit this data? Explain.
(Essay)
4.8/5 (37)
State whether the graph is or is not that of a function.
-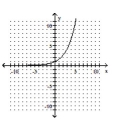
(Multiple Choice)
4.8/5 (33)
The population of a small town can be modeled by P where t is the number of years since 2010. Interpret the P-intercept of the graph of this function.
(Multiple Choice)
5.0/5 (36)
Write an equation of the line through the given point with the given slope. Write the equation in slope-intercept form.
-
(Multiple Choice)
4.7/5 (43)
Determine whether or not the relationship shown in the table is a function.
- January 1 2 3 4 5 6 7 Weight (lbs) 218 217 219 218 217 216 215 Does the table define the day in January as a function of weight?
(Multiple Choice)
4.8/5 (30)
Determine whether the given relationship defines a function. If so, identify the independent and dependent variable, and
why the relationship is a function.
-The salary s of an employee on her hiring date d.
(Multiple Choice)
4.9/5 (30)
Decide whether or not the set of ordered pairs defines a function.
-
(Multiple Choice)
4.9/5 (33)
Find the average rate of change for the function over the given interval.
- between and
(Multiple Choice)
4.9/5 (34)
Determine whether or not the relationship shown in the table is a function.
- Does the table define the price of a home that a particular family can afford as a function of the percent down payment?
(Multiple Choice)
4.9/5 (32)
Filters
- Essay(0)
- Multiple Choice(0)
- Short Answer(0)
- True False(0)
- Matching(0)