Exam 9: Design of Experiments and Analysis of Variance
Exam 1: Statistics, Data, and Statistical Thinking74 Questions
Exam 2: Methods for Describing Sets of Data188 Questions
Exam 3: Probability237 Questions
Exam 4: Random Variables and Probability Distributions273 Questions
Exam 5: Sampling Distributions52 Questions
Exam 6: Inferences Based on a Single Sample: Estimation With Confidence Intervals135 Questions
Exam 7: Inferences Based on a Single Sample: 355 Tests of Hypotheses144 Questions
Exam 8: Inferences Based on Two Samples: Confidence Intervals and Tests of Hypotheses102 Questions
Exam 9: Design of Experiments and Analysis of Variance87 Questions
Exam 10: Categorical Data Analysis59 Questions
Exam 11: Simple Linear Regression113 Questions
Exam 12: Multiple Regression and Model Building131 Questions
Exam 13: Methods for Quality Improvement: Statistical Process Control Available on CD89 Questions
Exam 14: Time Series: Descriptive Analyses, Models, and Forecasting Available on CD73 Questions
Exam 15: Nonparametric Statistics Available on CD49 Questions
Select questions type
Psychologists have found that people are generally reluctant to transmit bad news to their peers. This phenomenon has been named the "MUM effect." To investigate the cause of the MUM effect, undergraduates at a university participated in an experiment. Each subject was asked to administer an IQ test to another student and then provide the test taker with his or her percentile score.
(Unknown to the subject, the test taker was a bogus student who was working with the researchers.) The experimenters manipulated two factors, subject visibility and success of test taker, each at two levels. Subject visibility was either visible or not visible to the test taker. Success of test taker was either top 20% or bottom 20%. Ten subjects were randomly assigned to each of the 2 4 experimental conditions. Then the time (in seconds) between the end of the test and the delivery of the percentile score from the subject to the test taker was measured. (This variable is called the latency to feedback.) What type of experimental design was employed in this study?
Free
(Multiple Choice)
5.0/5  (38)
(38)
Correct Answer: Verified
C
A study was conducted to test the effectiveness of supermarket sales strategies. At one supermarket, the price level (regular, reduced price, and at cost to supermarket) and display level (normal display space, normal display space plus end-of-aisle display, and twice the normal display space) were tested to determine if they had any effect on the weekly sales of a particular supermarket product. Each of the combinations of price level and display level were put in place for a randomly selected week and the weekly sales of the product was recorded. Each combination was used three times over the course of the experiment. The results of the study are shown here: 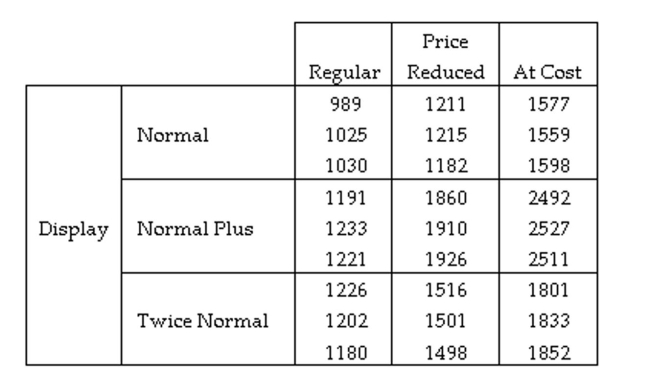 Identify the response variable used in this experiment.
Free
(Multiple Choice)
4.9/5 (29)
Correct Answer:Verified
B
Which procedure was specifically developed for pairwise comparisons when the sample sizes of the treatments are equal?
Free
(Multiple Choice)
4.7/5 (35)
Correct Answer:Verified
B
A local consumer reporter wants to compare the average costs of grocery items purchased at three different supermarkets, A, B, and C. Prices (in dollars) were recorded for a sample of 60 randomly selected grocery items at each of the three supermarkets. In order to reduce item-to-item variation,
The prices were recorded for each item on the same day at each supermarket.
The results of the ANOVA test are summarized in the following table.
Source df Anova SS Mean Square F Value Pr > F Supermkt 2 2.6412678 1.3206399 39.23 0.0001 Item 59 215.5949311 3.6541514 108.54 0.0001 Error 118 3.9725322 0.0336655 Corrected Total 179 222.2087311 What is the value of the test statistic for determining whether the three supermarkets have the sam average prices?
(Multiple Choice)
4.7/5 (29)
A multiple-comparison procedure for comparing four treatment means produced the confidence intervals shown below. Rank the means from smallest to largest. Use solid lines to connect those means which are not significantly different. - :(16,36) - :(8,22) - :(2,22) - :(-21,-1) - :(-23,-5) - :(-12,-1)
(Multiple Choice)
4.7/5 (39)
A beverage distributor wanted to determine the combination of advertising agency (two levels) and advertising medium (three levels) that would produce the largest increase in sales per advertising dollar. Each of the advertising agencies prepared ads as required for each of the media-- newspaper, radio, and television. Twelve small towns of roughly the same size were selected for the experiment, and two each were randomly assigned to receive an advertisement prepared and transmitted by each of the six agency-medium
combinations. The dollar increases in sales per advertising dollar, based on a 1-month sales period, are shown in the table.
Advertising Medium Newspaper Radio Television Agency 1 15.3,12.7 17.4,20.1 16.2,12.7 Agency 2 22.4,18.9 24.3,28.8 9.4,12.5 The SPSS analysis is shown below.
A N A L YSIS OF V ARIANCE***
SALES
BY AGENCY
MEDIUM
Sum of Mean Signif of F Source of Variation Squares DF Square F Main Effects 238.299 3 79.433 13.934 .004 AGENCY 39.967 1 39.967 7.011 .038 MEDIUM 198.332 2 99.166 17.395 .003 AGENCY*MEDIUM 77.345 2 38.672 6.784 .029 Explained 315.644 5 63.129 11.074 .005 Residual 34.205 6 5.701 Total 349.849 11 31.804 (Note: SPSS uses "Explained" instead of "Treatment" in the factorial analysis. Also, SPSS uses "Residual" instead of "Error.") Would you test the main effects factors, agency and medium, in this example? Explain why or why not.
(Essay)
4.9/5 (39)
A local consumer reporter wants to compare the average costs of grocery items purchased at three different supermarkets, A, B, and C. Prices (in dollars) were recorded for a sample of 60 randomly selected grocery items at each of the three supermarkets. In order to reduce item-to-item variation,
The prices were recorded for each item on the same day at each supermarket.
The results of a Bonferroni analysis are summarized below. Supermarket Mean Price 1.665 1.9191.925 Interpret the Bonferroni analysis results.
(Multiple Choice)
4.9/5 (36)
A company that employs a large number of salespeople is interested in learning which of the salespeople sell the most: those strictly on commission, those with a fixed salary, or those with a reduced fixed salary plus a commission. The previous month's records for a sample of salespeople are inspected and the amount of sales (in dollars) is recorded for each, as shown in the table.
Commissioned Fixed Salary Commission Plus Salary \ 507 \ 425 \ 492 \ 450 \ 443 \ 492 \ 532 \ 437 \ 470 \ 483 \ 432 \ 439 \ 466 \ 444 \ 410
ANALYSIS OF VARIANCE DF SS MS F SOURCE 2 4195 2097.7 3.17 FACTOR 12 7945 662.1 ERROR TOTAL 14 12140
Test to determine if a difference exists in the mean sale amounts among the three compensation systems. Test using .
(Essay)
4.9/5 (43)
Psychologists have found that people are generally reluctant to transmit bad news to their peers. This phenomenon has been named the "MUM effect." To investigate the cause of the MUM effect, 40 undergraduates at a certain university participated in an experiment. Each subject was asked to administer an IQ test to another student and then provide the test taker with his or her percentile score. (Unknown to the subject, the test taker was a bogus student who was working with the researchers.) The experimenters manipulated two factors, subject visibility and success of test taker, each at two levels. Subject visibility was either visible or not visible to the test taker. Success of test
Taker was either top 20% or bottom 20%. Ten subjects were randomly assigned to each of the 2 x 2 4 experimental conditions, then the time (in seconds) between the end of the test and the delivery of the percentile score from the subject to the test taker was measured. (This variable is called the latency to feedback.) The data was subject to an analysis of variance, with the following results:
Source df SS MS F PR > F Subject visibility 1 1380.24 1380.24 4.25 0.430 Test taker success 1 1325.16 1325.16 4.10 0.05 Visibility x success 1 3385.80 3385.80 10.45 .002 Error 36 11,664.00 324.00 Total 39 17,755.20
Which conclusion can you draw from the analysis? Use .
(Multiple Choice)
4.8/5 (25)
The results of a Tukey multiple comparison are summarized below. Treatment Sample Mean B 35.4 C 31.5 A 20.7 a. How many pairwise comparisons of the three treatments are there?
b. Which treatments are significantly different from each other?
c. Which treatments are not significantly different from each other?
(Essay)
4.7/5 (28)
Four brands of baseball bats were tested to determine which bat allowed hitters to hit a baseball farthest. Eight different batters were thrown 25 pitches while hitting with each of the four bats (assigned in random order). The average distance of the five longest hits using each bat is shown in the table below. The goal is to determine if the average hit distance differs for the four brands of baseball bats.
Batter Brand 1 Brand 2 Brand 3 Brand 4 1 307 315 300 275 2 310 317 305 285 3 335 335 330 302 4 325 328 320 300 5 300 305 295 270 6 345 350 340 310 7 312 315 308 300 8 298 302 295 288 The ANOVA table output is shown here: Source DF SS MS F P Batter 7 6227.4 946.77 39.70 0.0000 Brand 3 4117.6 1372.54 57.55 0.0000 Error 21 500.9 23.85 Total 31 11245.9
Identify the test statistic that should be used for testing whether the average distance hit for the four brands of baseball bats differ.
(Multiple Choice)
4.8/5 (38)
An experiment was conducted using a randomized block design. The data from the experiment are displayed in the following table.
TREATMENT BLOCK 1 2 3 1 11 16 9 2 10 19 9 3 13 15 10
Fill in the missing entries for an ANOVA table.
SOURCE df SS MS F Treatments 86.22 Blocks Error Total 100.22
(Essay)
4.8/5 (33)
A certain HMO is attempting to show the benefits of managed care to an insurance company. The HMO believes that certain types of doctors are more cost-effective than others. One theory is that certification level is an important factor in measuring the cost-effectiveness of physicians. To investigate this, the HMO obtained independent random samples of 30 physicians from each of the three certification levels- Board certified (C); Uncertified, board eligible (E); and Uncertified, board ineligible (I)- and recorded the total per-member, per-month charges for each (a total of 90 physicians). Identify the dependent (response) variable for this study.
(Multiple Choice)
4.9/5 (33)
307 diamonds were sampled and randomly sorted into three groups of diamonds. These diamonds were randomly assigned to one of the three organizations, or groups (HRD, GIA, or IGI), that certify the appraisal of diamonds. A study was conducted to determine if the average size of
Diamonds reported by these three certification groups differ. A completely randomized design was used and the Bonferroni multiple comparison results are shown below.
Bonferroni All-Pairwise Comparisons Test of CARAT by CERT
CERT Mean Bonferroni Groups HRD 0.8129 A GIA 0.6723 B IGI 0.3665 C
Alpha
Give the population mean(s) which are in the statistically largest group.
(Multiple Choice)
4.7/5 (37)
An industrial psychologist is investigating the effects of work environment on employee attitudes. A group of 20 recently hired sales trainees were randomly assigned to one of four different "home rooms"- five trainees per room. Each room is identical except for wall color. The four colors used were light green, light blue, gray, and red. The psychologist wants to know whether room color has an effect on attitude, and, if so, wants to compare the mean attitudes of the trainees assigned to the four room colors. At the end of the training program, the attitude of each trainee was measured on a60-pt. scale (the lower the score, the poorer the attitude). The data was subjected to a one-way analysis of variance.
ONE-WAY ANOVA FOR ATTITUDE BY COLOR
SOURCE DF SS MS BETWEEN 3 1678.15 559.3833 59.03782 0.0000 WITHIN 16 151.6 9.475 TOTAL 19 1829.75
SAMPLE GROUP COLOR MEAN SIZE STD DEV Blue 58.100 5 4.3589 Green 57.900 5 3.9623 Gray 39.100 5 1.5811 Red 40.300 5 0.8367
Give the null hypothesis for the ANOVA F-test shown on the printout.
(Multiple Choice)
4.8/5 (36)
In a study to determine the least amount of time necessary to clean an SUV while maintaining a high quality standard, the owner of a chain of car washes designed an experiment where 20 employees were divided into four groups, each with five members. Each member of each group was assigned an SUV to clean within a certain time limit. The time limits for the groups were 20
Minutes, 25 minutes, 30 minutes, and 35 minutes. After the time limits for each group had expired, the owner inspected each SUV and rated the quality of the cleaning job on a scale of 1 to 10. What are the possible values of the response variable?
(Multiple Choice)
4.9/5 (39)
A certain HMO is attempting to show the benefits of managed care to an insurance company. The HMO believes that certain types of doctors are more cost-effective than others. One theory is that certification level is an important factor in measuring the cost-effectiveness of physicians. To investigate this, the HMO obtained independent random samples of 20 physicians from each of the three certification levels - Board certified (C); Uncertified, board eligible (E); and Uncertified, board ineligible (I) - and recorded the total per member per month charges for each (a total of 60 physicians). In order to compare the mean charges for the three groups, the data were subjected to an analysis of variance. The results of the ANOVA are summarized in the following table. Take = 0.01
Source df SS MS F Value Prob > F Treatments 2 2180.796 1090.398 20.73 .0001 Error 57 2998.2 52.6 Total 59 5178.996
Interpret the -value of the ANOVA F -test.
(Multiple Choice)
4.7/5 (31)
The randomized block design is an extension of the matched pairs comparison of µ1 and µ2.
(True/False)
4.9/5 (25)
Filters
- Essay(0)
- Multiple Choice(0)
- Short Answer(0)
- True False(0)
- Matching(0)