Exam 5: Sampling Distributions
Exam 1: Statistics, Data, and Statistical Thinking74 Questions
Exam 2: Methods for Describing Sets of Data188 Questions
Exam 3: Probability237 Questions
Exam 4: Random Variables and Probability Distributions273 Questions
Exam 5: Sampling Distributions52 Questions
Exam 6: Inferences Based on a Single Sample: Estimation With Confidence Intervals135 Questions
Exam 7: Inferences Based on a Single Sample: 355 Tests of Hypotheses144 Questions
Exam 8: Inferences Based on Two Samples: Confidence Intervals and Tests of Hypotheses102 Questions
Exam 9: Design of Experiments and Analysis of Variance87 Questions
Exam 10: Categorical Data Analysis59 Questions
Exam 11: Simple Linear Regression113 Questions
Exam 12: Multiple Regression and Model Building131 Questions
Exam 13: Methods for Quality Improvement: Statistical Process Control Available on CD89 Questions
Exam 14: Time Series: Descriptive Analyses, Models, and Forecasting Available on CD73 Questions
Exam 15: Nonparametric Statistics Available on CD49 Questions
Select questions type
A random sample of n = 400 measurements is drawn from a binomial population with probability of success .21. Give the mean and the standard deviation of the sampling distribution of the sample Proportion,
Free
(Multiple Choice)
4.8/5  (43)
(43)
Correct Answer: Verified
D
The term statistic refers to a population quantity, and the term parameter refers to a sample quantity.
Free
(True/False)
4.8/5 (38)
Correct Answer:Verified
False
The sampling distribution of a sample statistic calculated from a sample of n measurements is the probability distribution of the statistic.
Free
(True/False)
4.8/5 (40)
Correct Answer:Verified
True
One year, the distribution of salaries for professional sports players had mean $1.6 million and standard deviation $0.7 million. Suppose a sample of 100 major league players was taken. Find the approximate probability that the average salary of the 100 players that year exceeded $1.1 million.
(Multiple Choice)
4.9/5 (34)
The probability distribution shown below describes a population of measurements.
0 2 4 () 1/3 1/3 1/3
Suppose that we took repeated random samples of observations from the population described above. Find the expected value of the sampling distribution of the sample mean.
(Multiple Choice)
4.9/5 (36)
Consider the population described by the probability distribution below. x 3 5 7 p(x) .1 .7 .2
a. Find .
b. Find the sampling distribution of the sample mean for a random sample of measurements from the distribution.
c. Show that is an unbiased estimator of .
(Essay)
4.7/5 (26)
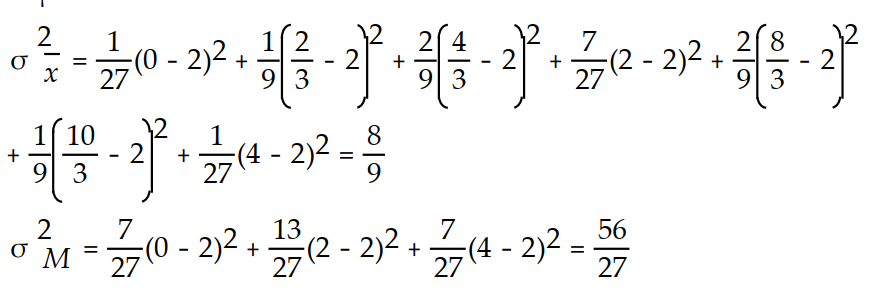
Consider the population described by the probability distribution below. x 0 2 4 p(x) a. Find .
b. Find the sampling distribution of the sample mean for a random sample of measurements from this distribution.
c. Find the sampling distribution of the sample median for a random sample of observations from this population.
d. Show that both the mean and the median are unbiased estimators of for this population.
e. Find the variances of the sampling distributions of the sample mean and the sample median.
f. Which estimator would you use to estimate ? Why?
(Essay)
4.8/5 (39)
The probability distribution shown below describes a population of measurements.
0 2 4 () 1/3 1/3 1/3
Suppose that we took repeated random samples of observations from the population described above. Which of the following would represent the sampling distribution of the sample mean?
(Multiple Choice)
4.8/5 (35)
The probability distribution shown below describes a population of measurements that can assume values of 2, 5, 8, and 11, each of which occurs with the same frequency:
x 2 5 8 11 p(x)
Consider taking samples of measurements and calculating for each sample. Construct the probability histogram for the sampling distribution of .
(Essay)
4.7/5 (37)
Suppose a random sample of measurements is selected from a population with mean and standard deviation . Find the values of and .
(Essay)
4.9/5 (37)
Which of the following does the Central Limit Theorem allow us to disregard when working with the sampling distribution of the sample mean?
(Multiple Choice)
4.8/5 (37)
A statistic is biased if the mean of the sampling distribution is equal to the parameter it is intended
to estimate.
(True/False)
4.7/5 (38)
The average score of all golfers for a particular course has a mean of 66 and a standard deviation of 3.5. Suppose 49 golfers played the course today. Find the probability that the average score of the 49 golfers exceeded 67.
(Multiple Choice)
4.8/5 (29)
In most situations, the true mean and standard deviation are unknown quantities that have to be estimated.
(True/False)
4.8/5 (31)
Suppose a random sample of measurements is selected from a population with mean and standard deviation . Find the -score corresponding to a value of .
(Short Answer)
4.9/5 (33)
Sample statistics are random variables, because different samples can lead to different values of the sample statistics.
(True/False)
4.8/5 (43)
A random sample of size n is to be drawn from a population with What size sample would be necessary in order to reduce the standard error to 10?
(Essay)
4.8/5 (39)
The minimum-variance unbiased estimator (MVUE) has the least variance among all unbiased estimators.
(True/False)
4.9/5 (37)
Which of the following describes what the property of minimum variance means?
(Multiple Choice)
4.8/5 (35)
Consider the population described by the probability distribution below.
x 2 5 7 p(x) .2 .5 .3
The random variable is observed twice. The observations are independent. The different samples of size 2 and their probabilities are shown below.
Sample Probability 2,2 .04 2,5 .10 2,7 .06 Sample Probability 5,2 .10 5,5 .25 5,7 .15 Sample Probability 7,2 .06 7,5 .15 7,7 .09
Find the sampling distribution of the sample mean .
(Essay)
4.8/5 (42)
Filters
- Essay(0)
- Multiple Choice(0)
- Short Answer(0)
- True False(0)
- Matching(0)