Exam 13: Methods for Quality Improvement: Statistical Process Control Available on CD
Exam 1: Statistics, Data, and Statistical Thinking74 Questions
Exam 2: Methods for Describing Sets of Data188 Questions
Exam 3: Probability237 Questions
Exam 4: Random Variables and Probability Distributions273 Questions
Exam 5: Sampling Distributions52 Questions
Exam 6: Inferences Based on a Single Sample: Estimation With Confidence Intervals135 Questions
Exam 7: Inferences Based on a Single Sample: 355 Tests of Hypotheses144 Questions
Exam 8: Inferences Based on Two Samples: Confidence Intervals and Tests of Hypotheses102 Questions
Exam 9: Design of Experiments and Analysis of Variance87 Questions
Exam 10: Categorical Data Analysis59 Questions
Exam 11: Simple Linear Regression113 Questions
Exam 12: Multiple Regression and Model Building131 Questions
Exam 13: Methods for Quality Improvement: Statistical Process Control Available on CD89 Questions
Exam 14: Time Series: Descriptive Analyses, Models, and Forecasting Available on CD73 Questions
Exam 15: Nonparametric Statistics Available on CD49 Questions
Select questions type
In constructing a p-chart, it is advisable to use a much smaller sample size than is typically used for and R-charts.
Free
(True/False)
4.9/5  (35)
(35)
Correct Answer: Verified
False
When n ≤ 6, the R-chart contains only one control limit, the lower control limit.
Free
(True/False)
4.8/5 (41)
Correct Answer:Verified
False
(Situation E) A machine at K-Company fills boxes with bran flake cereal. The target weight for the filled boxes is 24 ounces. The company would like to use control charts to monitor the performance of the machine. The company decides to sample and weigh 10 consecutive boxes of cereal at randomly selected times over a two-week period. Twenty measurement times are selected and the following information is recorded. Time Mean (oz) Range (oz) Time Mean (oz) Range (oz) 1 23.8 1.05 11 24.5 1.21 2 24.5 0.85 12 24.7 0.65 3 23.9 1.12 13 24.0 0.55 4 24.2 0.95 14 25.5 3.21 5 23.7 1.22 15 24.2 1.25 6 23.5 1.42 16 24.4 1.35 7 24.2 1.02 17 24.5 0.98 8 24.4 1.10 18 25.0 1.30 9 24.1 0.75 19 24.1 0.88 10 24.2 0.60 20 24.2 1.01
-Calculate the upper and lower control limits for the
Free
(Essay)
4.7/5 (34)
Correct Answer:Verified
The process of monitoring and eliminating variation in order to keep a process in a state of control or to bring a process into control is called
(Multiple Choice)
4.8/5 (35)
Special causes of variation can often be diagnosed and eliminated by workers or their immediate supervisors.
(True/False)
4.7/5 (33)
(Situation B) A manufacturing company makes hemostats for hospital emergency rooms. The company is interested in implementing statistical process control procedures in its production operation. The production manager believes that the proportion of defective hemostats generated by the process is about 3%. The company collected one sample of 300
consecutively manufactured hemostats each day for 20 days. The data are shown below. Sample Sample Size Defectives Sample Sample Size Defectives 1 300 8 11 300 12 2 300 6 12 300 11 3 300 11 13 300 14 4 300 15 14 300 8 5 300 12 15 300 7 6 300 11 16 300 3 7 300 9 17 300 9 8 300 6 18 300 11 9 300 5 19 300 10 10 300 4 20 300 6
-Calculate the centerline used in constructing a
(Multiple Choice)
4.8/5 (30)
The table below shows the data from samples of size randomly chosen from the outputs of a process on 20 different days. Assume the specification limits are USL and .
Sample Data 1 4.5 2.1 5.4 2.7 4.5 2 3.6 3.5 6.1 4.9 4.2 3 5.1 6.2 2.4 3.7 5.1 4 4.9 5.4 3.5 5.4 3.7 5 4.1 3.8 3.8 4.6 4.9 6 3.7 4.6 4.8 4.2 5.2 7 5.6 4.7 4.1 5.1 3.1 8 4.8 5.1 4.3 4.6 2.7 9 6.1 4.6 4.7 3.8 4.2 10 2.4 4.8 5.6 4.1 4.8 11 3.7 5.3 2.9 4.7 6.3 12 4.5 3.4 3.4 5.2 4.5 13 5.2 2.7 5.1 6.2 2.9 14 3.4 5.5 4.6 2.4 3.4 15 4.8 3.6 4.8 4.4 4.6 16 4.1 4.6 4.9 4.9 4.3 17 4.6 3.7 3.5 3.7 5.2 18 5.1 4.2 5.6 4.1 5.7 19 3.7 4.8 4.9 2.3 4.5 20 5.4 3.9 4.2 5.4 4.3
a. Assuming the process is under control, construct a capability analysis diagram for the process.
b. Find the percentage of data items that fall outside the specification limits.
c. Is the process capable? Support your answer with a numerical measure of capability.
(Essay)
4.8/5 (33)
The p-chart is typically used to monitor the proportion of units that conform to specification.
(True/False)
4.8/5 (35)
Does the following control chart represent a process that is in control or out of control? If it is out of control, explain how you arrived at this conclusion. 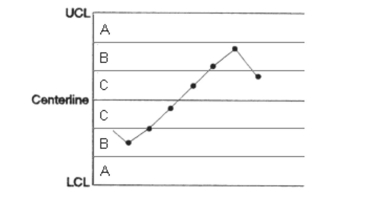
(Essay)
4.8/5 (25)
An unbiased estimator for ? can be found by dividing the mean of the ranges, by an appropriate constant.
(True/False)
4.9/5 (39)
The p-chart is based on the assumption that the number of defective units in each sample is a binomial random variable.
(True/False)
4.8/5 (34)
(Situation C) Ten samples of were collected to construct an -chart. The sample means and ranges for the 10 samples are shown below.
Sample Mean Range Sample Mean Range 1 20.2 2.7 6 20.4 1.9 2 22.4 1.8 7 15.9 1.0 3 21.2 1.5 8 22.3 2.1 4 18.2 1.2 9 20.7 1.6 5 23.2 2.4 10 21.1 1.8
-Calculate the upper and lower control limits for the
(Essay)
5.0/5 (38)
If the R-chart indicates that the process variation is in control, then it makes sense to construct and interpret the chart.
(True/False)
4.9/5 (39)
Does the following control chart represent a process that is in control or out of control? If it is out of control, explain how you arrived at this conclusion. 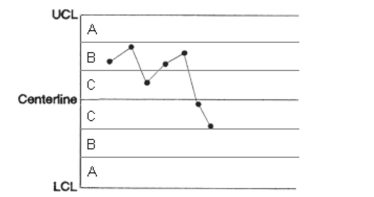
(Essay)
4.8/5 (27)
The diagnosis phase of statistical process control is concerned with tracking down causes of variation.
(True/False)
4.8/5 (44)
Does the following control chart represent a process that is in control or out of control? If it is out of control, explain how you arrived at this conclusion. 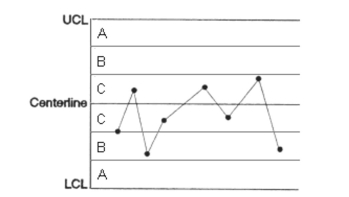
(Short Answer)
4.8/5 (33)
A system receives inputs from its environment, transforms those inputs to outputs, and delivers them to its environment.
(True/False)
4.7/5 (31)
A process is in control and has a normally distributed output distribution with mean of 1000 and a standard deviation of 100 . The upper and lower specification limits for the process are 1060 and 940 , respectively. Find the value of the process. Is the system capable?
(Multiple Choice)
4.7/5 (33)
Filters
- Essay(0)
- Multiple Choice(0)
- Short Answer(0)
- True False(0)
- Matching(0)