Exam 2: Methods for Describing Sets of Data
Exam 1: Statistics, Data, and Statistical Thinking74 Questions
Exam 2: Methods for Describing Sets of Data188 Questions
Exam 3: Probability237 Questions
Exam 4: Random Variables and Probability Distributions273 Questions
Exam 5: Sampling Distributions52 Questions
Exam 6: Inferences Based on a Single Sample: Estimation With Confidence Intervals135 Questions
Exam 7: Inferences Based on a Single Sample: 355 Tests of Hypotheses144 Questions
Exam 8: Inferences Based on Two Samples: Confidence Intervals and Tests of Hypotheses102 Questions
Exam 9: Design of Experiments and Analysis of Variance87 Questions
Exam 10: Categorical Data Analysis59 Questions
Exam 11: Simple Linear Regression113 Questions
Exam 12: Multiple Regression and Model Building131 Questions
Exam 13: Methods for Quality Improvement: Statistical Process Control Available on CD89 Questions
Exam 14: Time Series: Descriptive Analyses, Models, and Forecasting Available on CD73 Questions
Exam 15: Nonparametric Statistics Available on CD49 Questions
Select questions type
Many firms use on-the-job training to teach their employees computer programming. Suppose you work in the personnel department of a firm that just finished training a group of its employees to program, and you have been requested to review the performance of one of the trainees on the
Final test that was given to all trainees. The mean and standard deviation of the test scores are 79 and 2, respectively, and the distribution of scores is mound-shaped and symmetric. Suppose the trainee in question received a score of 76. Compute the trainee's z-score.
A)
B)
C)
D)
Free
(Short Answer)
4.8/5  (33)
(33)
Correct Answer: Verified
B
The calculator screens summarize a data set. 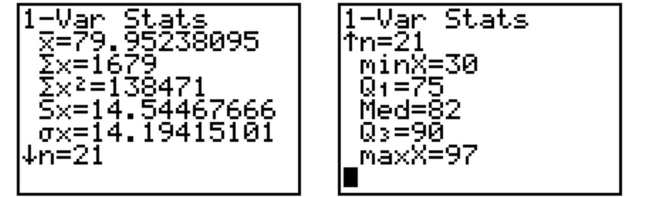 a. Identify the smallest measurement in the data set.
b. Identify the largest measurement in the data set.
c. Calculate the range of the data set.
a. Identify the smallest measurement in the data set.
b. Identify the largest measurement in the data set.
c. Calculate the range of the data set.
Free
(Essay)
4.7/5 (36)
Correct Answer:Verified
a.
b.
C.
Which is expressed in the same units as the original data, the variance or the standard deviation?
Free
(Short Answer)
4.9/5 (36)
Correct Answer:Verified
standard deviation
The test scores of 30 students are listed below. Which number could be the 30th percentile?
31 41 45 48 52 55 56 56 63 65 67 67 69 70 70 74 75 78 79 79 80 81 83 85 85 87 90 92 95 99
(Multiple Choice)
4.8/5 (36)
The calculator screens summarize a data set. 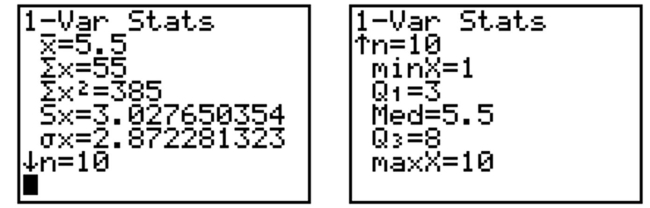 a. Identify the mean and the sample standard deviation. Round to one place after the decimal, where necessary.
b. Find the interval that corresponds to measurements within two standard deviations of the mean.
a. Identify the mean and the sample standard deviation. Round to one place after the decimal, where necessary.
b. Find the interval that corresponds to measurements within two standard deviations of the mean.
(Essay)
4.8/5 (38)
A study was designed to investigate the effects of two variables - (1) a student's level of mathematical anxiety and (2) teaching method - on a student's achievement in a mathematics course. Students who had a low level of mathematical anxiety were taught using the traditional expository method. These students obtained a mean score of 440 with a standard deviation of 50 on a standardized test. Assuming a mound-shaped and symmetric distribution, in what range would approximately 68% of the students score?
(Multiple Choice)
4.7/5 (37)
Each year advertisers spend billions of dollars purchasing commercial time on network television. In the first 6 months of one year, advertisers spent $1.1 billion. Who were the largest spenders? In a recent article, the top 10 leading spenders and how much each spent (in million of dollars) were listed:
Company A \ 71 Company F \ 25.9 Company B 63.7 Company G 24.6 Company C 54.5 Company H 23.1 Company D 54.1 Company I 23.6 Company E 28.5 Company J 19.8
Calculate the mean and median for the data.
(Essay)
4.8/5 (34)
The scores of nine members of a women's golf team in two rounds of tournament play are listed below.
Player 1 2 3 4 5 6 7 8 9 Round 1 85 90 87 78 92 85 79 93 86 Round 2 90 87 85 84 86 78 77 91 82 Construct a scattergram for the data.
(Essay)
5.0/5 (44)
Parking at a university has become a problem. University administrators are interested in determining the average time it takes a student to find a parking spot. An administrator inconspicuously followed 90 students and recorded how long it took each of them to find a parking spot. Which of the following types of graphs should not be used to display information concerning
The students parking times?
(Multiple Choice)
5.0/5 (38)
A dot plot of the speeds of a sample of 50 cars passing a policeman with a radar gun is shown below. 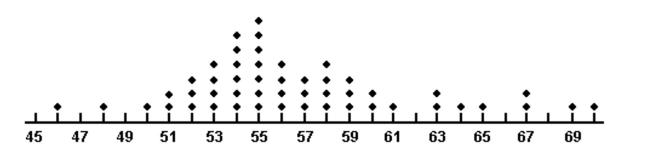 What proportion of the motorists were driving above the posted speed limit of 55 miles per hour?
(Multiple Choice)
4.7/5 (39)
A radio station claims that the amount of advertising each hour has a mean of 15 minutes and a standard deviation of 1.5 minutes. You listen to the radio station for 1 hour and observe that the amount of advertising time is 9 minutes. Calculate the z-score for this amount of advertising time.
A)
B)
C)
D)
(Short Answer)
4.8/5 (40)
The output below displays the mean and median for the state high school dropout rates in
year 1 and in year 5. Year 1 Year 5 N 51 51 MEAN 28.22 26.56 MEDIAN 27.53 25.18 Use the information to determine the shape of the distributions of the high school dropout rates in year 1 and year 5.
(Essay)
4.9/5 (31)
Each year advertisers spend billions of dollars purchasing commercial time on network television. In the first 6 months of one year, advertisers spent $1.1 billion. Who were the largest spenders? In a recent article, the top 10 leading spenders and how much each spent (in million of dollars) were
Listed: Company A \ 70.7 Company F \ 24.8 Company B 63.9 Company G 24 Company C 55.7 Company H 22.7 Company D 54.2 Company I 23.2 Company E 30.3 Company J 20.1 Calculate the sample variance.
(Multiple Choice)
4.8/5 (34)
A shoe retailer keeps track of all types of information about sales of newly released shoe styles. One newly released style was marketed to tall people. Listed below are the shoe sizes of 12 randomly selected customers who purchased the new style. Find the mode of the shoe sizes.
9 11 12 11 8 10 8 11 10 11 9 10
(Multiple Choice)
4.9/5 (37)
A sociologist recently conducted a survey of senior citizens who have net worths too high to qualify for Medicaid but have no private health insurance. The ages of the 25 uninsured senior citizens were as follows:
72 77 70 80 90 78 65 93 69 94 73 96 80 66 85 67 72 85 74 77 64 91 79 68 86 Find the median of the observations.
(Multiple Choice)
4.9/5 (29)
The scatterplot below shows a negative relationship between two variables. 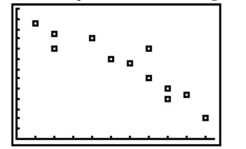
(True/False)
4.7/5 (41)
The range is an insensitive measure of data variation for large data sets because two data sets can have the same range but be vastly different with respect to data variation.
(True/False)
4.8/5 (38)
The amount of time workers spend commuting to their jobs each day in a large metropolitan city has a mean of 70 minutes and a standard deviation of 20 minutes. Assuming the distribution of commuting times is known to be moundshaped and symmetric, what percentage of these commuting times are between 50 and 110 minutes?
(Multiple Choice)
4.9/5 (40)
Filters
- Essay(0)
- Multiple Choice(0)
- Short Answer(0)
- True False(0)
- Matching(0)