Exam 10: Analysis of Variance: Comparing More Than Two Means
Exam 1: Statistics, Data, and Statistical Thinking73 Questions
Exam 2: Methods for Describing Sets of Data194 Questions
Exam 3: Probability283 Questions
Exam 4: Discrete Random Variables133 Questions
Exam 5: Continuous Random Variables139 Questions
Exam 6: Sampling Distributions47 Questions
Exam 7: Inferences Based on a Single Sample: Estimation With Confidence Intervals124 Questions
Exam 8: Inferences Based on a Single Sample: Tests of Hypothesis140 Questions
Exam 9: Inferences Based on a Two Samples: Confidence Intervals and Tests of Hypotheses94 Questions
Exam 10: Analysis of Variance: Comparing More Than Two Means90 Questions
Exam 11: Simple Linear Regression111 Questions
Exam 12: Multiple Regression and Model Building131 Questions
Exam 13: Categorical Data Analysis60 Questions
Exam 14: Nonparametric Statistics90 Questions
Select questions type
Psychologists have found that people are generally reluctant to transmit bad news to their peers. This phenomenon has been named the "MUM effect." To investigate the cause of the MUM effect, 40 undergraduates at a certain university participated in an experiment. Each subject was asked to administer an IQ test to another student and then provide the test taker with his or her percentile score. (Unknown to the subject, the test taker was a bogus student who was working with the researchers.) The experimenters manipulated two factors, subject visibility and success of test taker, each at two levels. Subject visibility was either visible or not visible to the test taker. Success of test taker was either top 20% or bottom 20%. Ten subjects were randomly assigned to each of the 2 x 2 = 4 experimental conditions, then the time (in seconds) between the end of the test and the delivery of the percentile score from the subject to the test taker was measured. (This variable is called the latency to feedback.) The data was subject to an analysis of variance, with the following results: Source df SS MS F PR > F Subject visibility 1 1380.24 1380.24 4.25 0.430 Test taker success 1 1325.16 1325.16 4.10 0.05 Visibility x success 1 3385.80 3385.80 10.45 .002 Error 36 11,664.00 324.00 Total 39 17,755.20 Which conclusion can you draw from the analysis? Use ? = .01.
Free
(Multiple Choice)
4.9/5  (33)
(33)
Correct Answer: Verified
A
A study was conducted to test the effectiveness of supermarket sales strategies. At one supermarket, the price level (regular, reduced price, and at cost to supermarket) and display level (normal display space, normal display space plus end-of-aisle display, and twice the normal display space) were tested to determine if they had any effect on the weekly sales of a particular supermarket product. Each of the combinations of price level and display level were put in place for a randomly selected week and the weekly sales of the product was recorded. Each combination was used three times over the course of the experiment. The results of the study are shown here: 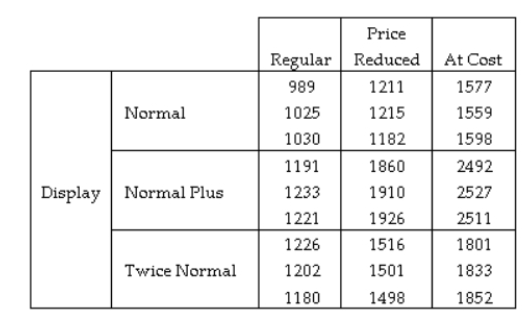 The ANOVA table is shown below: Source DF SS MS F P Display 2 1691393 845696 1709.37 0.0000 Price 2 3089054 154427 3121.89 0.0000 Display Price 4 510705 127676 258.07 0.0000 Error 18 8905 495 Total 26 5300057 Which of the following tests should be conducted first?
Free
(Multiple Choice)
5.0/5 (32)
Correct Answer:Verified
A
Consider a completely randomized design with five treatments. How many pairwise comparisons of treatments are made in a Bonferroni analysis?
Free
(Multiple Choice)
4.8/5 (40)
Correct Answer:Verified
A
Which procedure was specifically developed for pairwise comparisons when the sample sizes of the treatments are equal?
(Multiple Choice)
4.9/5 (35)
Given that the sum of squares for error (SSE) for an ANOVA F-test is 12,000 and there are 40 total experimental units with eight total treatments, find the mean square for error (MSE).
(Multiple Choice)
4.9/5 (35)
Four brands of baseball bats were tested to determine which bat allowed hitters to hit a baseball farthest. Eight different batters were thrown 25 pitches while hitting with each of the four bats (assigned in random order). The average distance of the five longest hits using each bat is shown in the table below. The goal is to determine if the average hit distance differs for the four brands of baseball bats. Batter Brand 1 Brand 2 Brand 3 Brand 4 1 307 315 300 275 2 310 317 305 285 3 335 335 330 302 4 325 328 320 300 5 300 305 295 270 6 345 350 340 310 7 312 315 308 300 8 298 302 295 288 The ANOVA table output is shown here: Source DF SS MS F P Batter 7 6227.4 946.77 39.70 0.0000 Brand 3 4117.6 1372.54 57.55 0.0000 Error 21 500.9 23.85 Total 31 11245.9 Based on the p-value for this test, make the proper conclusion about the treatments in this experiment.
(Multiple Choice)
4.9/5 (32)
Which of the following is not a condition required for a valid ANOVA F-test for a completely randomized experiment?
(Multiple Choice)
4.9/5 (37)
A local consumer reporter wants to compare the average costs of grocery items purchased at three different supermarkets, A, B, and C. Prices (in dollars) were recorded for a sample of 60 randomly selected grocery items at each of the three supermarkets. In order to reduce item-to-item variation, the prices were recorded for each item on the same day at each supermarket. The results of the ANOVA are summarized in the following table. Source df Anova SS Mean Square F Value Pr > Supermkt 2 2.6412678 1.3206399 39.23 0.0001 Item 59 215.5949311 3.6541514 108.54 0.0001 Error 118 3.9725322 0.0336655 Corrected Total 179 222.2087311 Based on the p-value of the test, make the proper conclusion.
(Multiple Choice)
4.9/5 (31)
A certain HMO is attempting to show the benefits of managed care to an insurance company. The HMO believes that certain types of doctors are more cost-effective than others. One theory is that certification level is an important factor in measuring the cost-effectiveness of physicians. To investigate this, the HMO obtained independent random samples of 30 physicians from each of the three certification levels- Board certified (C); Uncertified, board eligible (E); and Uncertified, board ineligible (I)- and recorded the total per-member, per-month charges for each (a total of 90 physicians). Identify the dependent (response) variable for this study.
(Multiple Choice)
4.9/5 (46)
The __________ in a designed experiment to compare k means is the probability of making at least one Type I error in a series of inferences about the population means, based on (1 - α) 100% confidence intervals.
(Essay)
4.9/5 (32)
In a study to determine the least amount of time necessary to clean an SUV while maintaining a high quality standard, the owner of a chain of car washes designed an experiment where 20 employees were divided into four groups, each with five members. Each member of each group was assigned an SUV to clean within a certain time limit. The time limits for the groups were 20 minutes, 25 minutes, 30 minutes, and 35 minutes. After the time limits for each group had expired, the owner inspected each SUV and rated the quality of the cleaning job on a scale of 1 to 10. What are the possible values of the response variable?
(Multiple Choice)
4.9/5 (35)
Suppose an experiment utilizing a random block design has 4 treatments and 10 blocks for a total of 40 observations. Assume that the total Sum of Squares for the response is SS(Total) = 300. If the Sum of Squares for Treatments (SST) is 20% of SS(Total), and the Sum of Squares for Blocks (SSB) is 40% of SS (Total), find the F values for this experiment.
(Multiple Choice)
4.9/5 (39)
A certain HMO is attempting to show the benefits of managed health care to an insurance company. The HMO believes that certain types of doctors are more cost-effective than others. One theory is that both primary specialty and whether the physician is a foreign or USA medical school graduate are an important factors in measuring the cost-effectiveness of physicians. To investigate this, the president obtained independent random samples of 40 HMO physicians, half foreign graduates and half USA graduates, from each of four primary specialties?General Practice (GP), Internal Medicine (IM), Pediatrics (PED), and Family Physician (FP)?and recorded the total per-member, per-month charges for each. Thus, information on charges were obtained for a total of n = 160 doctors. The sample mean charges for each of the eight categories are shown in the table. Primary Specialty Foreign Grad USA Grad GP 39.80 42.20 IM 55.80 53.50 PED 23.50 25.30 FP 38.00 41.80 What type of design was used for this experiment?
(Multiple Choice)
4.8/5 (28)
An experiment was conducted to compare the mean iron content in iron ore pieces determined by three different methods: (1) mechanical, (2) manual, and (3) laser. Five 1-meter long pieces of iron ore were removed from a conveyor belt, and the iron content of each piece was determined using each of the three methods. The data are shown below. How should the data be analyzed? Piece Mechanical Manual Laser 1 69.26 70.29 69.23 2 74.36 74.86 75.38 3 69.24 69.30 70.58 4 67.26 67.29 67.13 5 62.12 61.14 63.08
(Multiple Choice)
4.9/5 (45)
Four different leadership styles used by Big-Six accountants were investigated. As part of a designed study, 15 accountants were randomly selected from each of the four leadership style groups (a total of 60 accountants). Each accountant was asked to rate the degree to which their subordinates performed substandard field work on a 10-point scale-called the "substandard work scale". The objective is to compare the mean substandard work scales of the four leadership styles. The data on substandard work scales for all 60 observations were subjected to an analysis of variance.
SOURCE DF SS MS F P BETWEEN 3 2523.92 841.306 4.980 0.0039 WITHIN 56 9460.47 168.937 TOTAL 59 11,984.39
Interpret the results of the ANOVA -test shown on the printout for .
A) At , there is sufficient evidence of differences among the substandard work scale means for the four leadership styles.
B) At , there is no evidence of interaction.
C) At , nothing can be said.
D) At , there is insufficient evidence of differences among the substandard work scale means for the four leadership styles.
(Short Answer)
4.8/5 (36)
__________ is a particular combination of levels of the factors involved in a study.
(Multiple Choice)
4.8/5 (30)
An article in a journal examined the attitudes of three groups of professionals on the condition of the environment, and quantified their responses on a seven-point scale (1 = no problem to 7 = disaster very likely). The mean scores for the groups are: A: 3.60 , B: 3.32 , and C: 3.29 . Using an experimentalwise error rate of α = .05, Tukey's minimum significance for comparing means is 0.27. Use this information to conduct a multiple comparisons of the means.
(Multiple Choice)
4.8/5 (38)
A certain HMO is attempting to show the benefits of managed health care to an insurance company. The HMO believes that certain types of doctors are more cost-effective than others. One theory is that primary specialty is an important factor in measuring the cost-effectiveness of physicians. To investigate this, the HMO obtained independent random samples of 20 HMO physicians from each of four primary specialties-General Practice (GP), Internal Medicine (IM), Pediatrics (PED), and Family Physician (FP) ? and recorded the total per-member, per-month charges for each. In order to compare the mean charges for the four specialty groups, the data were be subjected to a one-way analysis of variance. The results of the Tukey analysis are summarized below. Group Sample Mean IM 55.9 GP 41.4 FP 39.00 PED 24.60 Which primary specialties have significantly lower mean charges than Internal Medicine (IM)?
(Multiple Choice)
4.8/5 (41)
Filters
- Essay(0)
- Multiple Choice(0)
- Short Answer(0)
- True False(0)
- Matching(0)