Exam 10: Analysis of Variance: Comparing More Than Two Means
Exam 1: Statistics, Data, and Statistical Thinking73 Questions
Exam 2: Methods for Describing Sets of Data194 Questions
Exam 3: Probability283 Questions
Exam 4: Discrete Random Variables133 Questions
Exam 5: Continuous Random Variables139 Questions
Exam 6: Sampling Distributions47 Questions
Exam 7: Inferences Based on a Single Sample: Estimation With Confidence Intervals124 Questions
Exam 8: Inferences Based on a Single Sample: Tests of Hypothesis140 Questions
Exam 9: Inferences Based on a Two Samples: Confidence Intervals and Tests of Hypotheses94 Questions
Exam 10: Analysis of Variance: Comparing More Than Two Means90 Questions
Exam 11: Simple Linear Regression111 Questions
Exam 12: Multiple Regression and Model Building131 Questions
Exam 13: Categorical Data Analysis60 Questions
Exam 14: Nonparametric Statistics90 Questions
Select questions type
The goal of an experiment is to investigate the factors that affect visitor travel time in a complex, multilevel building on campus. Specifically, we want to determine whether the effect of directional aid (wall signs or map) on travel time depends on starting room location (interior or exterior). Three visitors were assigned to each of the combinations of directional aid and starting room location, and the travel times of each (in seconds) to reach the goal destination room were recorded. DIRECTIONAL AID STARTING Interior ROOM Exterior Wall signs 159 243 119 330 203 143 Map 163 247 124 324 215 145 Explain how to properly analyze these data.
(Multiple Choice)
4.9/5  (39)
(39)
A local consumer reporter wants to compare the average costs of grocery items purchased at three different supermarkets, A, B, and C. Prices (in dollars) were recorded for a sample of 60 randomly selected grocery items at each of the three supermarkets. In order to reduce item-to-item variation, the prices were recorded for each item on the same day at each supermarket. The results of a Bonferroni analysis are summarized below. ___________ Supermarket A Mean Price 1.665 1.9191.925
Interpret the Bonferroni analysis results.
(Multiple Choice)
4.8/5 (37)
A scientist is hoping to compare the mean levels of DDT toxin found in three species of fish in a local river. He randomly samples 50 of each species to use in the analysis. For each fish, he measures the amount of DDT toxin present. Ideally he will be able to rank the species based on the mean level of toxin found in each of the three species. Identify the response variable in this study.
(Multiple Choice)
4.8/5 (36)
Four brands of baseball bats were tested to determine which bat allowed hitters to hit a baseball farthest. Eight different batters were thrown 25 pitches while hitting with each of the four bats (assigned in random order). The average distance of the five longest hits using each bat is shown in the table below. The goal is to determine if the average hit distance differs for the four brands of baseball bats. Batter Brand 1 Brand 2 Brand 3 Brand 4 1 307 315 300 275 2 310 317 305 285 3 335 335 330 302 4 325 328 320 300 5 300 305 295 270 6 345 350 340 310 7 312 315 308 300 8 298 302 295 288 A partial ANOVA table is shown below. Source DF SS MS F Batter 7 946.77 Brand 3 Error 21 500.9 Total 31 11245.9 Find the F-value in the table above for testing whether the average distance hit for the four brands of baseball bats differ.
(Multiple Choice)
4.8/5 (38)
A multiple-comparison procedure for comparing four treatment means produced the confidence intervals shown below. For each pair of means, indicate which mean is larger or indicate that there is no significant difference. - :(11,17) - :(-6,2) - :(12,18) - :(-23,-9) - :(-6,8) - :(11,23)
A) ; no significant difference between and ; no significant difference between and
B)
C) ; no significant difference between and ; no significant difference between and
D) no significant difference between and ; no significant difference between and ; ; no significant difference between and
(Short Answer)
4.9/5 (27)
In an experiment with 10 treatments, how many pairs of means can be compared?
(Multiple Choice)
4.8/5 (39)
A multiple-comparison procedure for comparing four treatment means produced the confidence intervals shown below. For each pair of means, indicate which mean is larger or indicate that there is no significant difference. - :(18,34) - :(7,23) - :(6,18) - :(-18,-4) - :(-24,-4) - :(-10,4)
A) no significant difference between and
B)
C) ; no significant difference between and
D) no significant difference between and ; ; no significant difference between and
(Short Answer)
4.8/5 (35)
Find the critical value F0 for a one-tailed test using α = 0.05, with 8 numerator degrees of freedom and 15 denominator degrees of freedom
(Multiple Choice)
4.9/5 (39)
Given that the sum of squares for treatments (SST) for an ANOVA F-test is 9,000 and there are four total treatments, find the mean square for treatments (MST).
(Multiple Choice)
4.8/5 (31)
307 diamonds were sampled and randomly sorted into three groups of diamonds. These diamonds were randomly assigned to one of the three organizations, or groups (HRD, GIA, or IGI), that certify the appraisal of diamonds. A study was conducted to determine if the average size of diamonds reported by these three certification groups differ. A completely randomized design was used and the resulting ANOVA table is shown below. One-Way AOV for CARAT by CERT Source DF SS MS F P CERT 2 8.3265 4.16326 83.21 0.0000 Error 305 15.2604 0.05003 Total 307 23.5869 Give a practical conclusion for the test in the words of the problem. Use ? = 0.10 to make your conclusion.
(Multiple Choice)
4.9/5 (32)
A market research firm is interested in the possible success of new flavors of ice cream. A study was conducted with three different flavorsꟷpeach, almond, and coconut. Three participants were given a sample of each ice cream, in random order, and asked to rate the flavors on a 100-point scale. The results are given in the table below.
PARTICIPANT Peach Almond Coconut 1 77 85 75 2 82 100 80 3 85 91 76 a. What is the purpose of blocking on participants in this study? b. Construct an ANOVA summary table using the information given. c. Is there sufficient evidence of a difference in the mean ratings for the three flavors? Use α = 0.05.
(Essay)
4.9/5 (27)
A local consumer reporter wants to compare the average costs of grocery items purchased at three different supermarkets, A, B, and C. Prices (in dollars) were recorded for a sample of 60 randomly selected grocery items at each of the three supermarkets. In order to reduce item-to-item variation, the prices were recorded for each item on the same day at each supermarket. Item 1) paper towels 1.21 1.41 1.36 2) cereal 2.81 3.26 3.01 3) floor cleaner 6.03 5.91 6.92 | | | | | 59) shaving cream 1.09 0.99 1.05 60) canned green beans 0.45 0.60 0.37 Identify the blocks for this experiment.
(Multiple Choice)
4.9/5 (44)
An appliance manufacturer is interested in determining whether the brand of laundry detergent used affects the average amount of dirt removed from standard household laundry loads. An experiment is set up in which 10 laundry loads are randomly assigned to each of four laundry detergents-Brands A, B, C, and D (a total of 40 loads in the experiment). The amount of dirt removed, y, (measured in milligrams) for each load is recorded and subjected to an ANOVA analysis, including a follow-up Tukey analysis. Which of the following inferences concerning the Tukey results below is incorrect? Brands Sample Means D 187 C 179 B 149 A 132
A)
B)
C)
D)
(Short Answer)
4.9/5 (35)
A company that employs a large number of salespeople is interested in learning which of the salespeople sell the most: those strictly on commission, those with a fixed salary, or those with a reduced fixed salary plus a commission. The previous month's records for a sample of salespeople are inspected and the amount of sales (in dollars) is recorded for each, as shown in the table. Commissioned Fixed Salary Commission Plus Salary \ 492 \ 450 \ 425 \ 507 \ 418 \ 492 \ 507 \ 437 \ 470 \ 483 \ 432 \ 506 \ 466 \ 444 \ 425 ANALYSIS OF VARIANCE DF SS MS F SOURCE 2 4195 2097.7 3.17 FACTOR 12 7945 662.1 ERROR TOTAL 14 12140 Test to determine if a difference exists in the mean sale amounts among the three compensation systems. Test using α = .025. 10.3 Multiple Comparisons of Means
(Essay)
4.9/5 (31)
A study was conducted to test the effectiveness of supermarket sales strategies. At one supermarket, the price level (regular, reduced price, and at cost to supermarket) and display level (normal display space, normal display space plus end-of-aisle display, and twice the normal display space) were tested to determine if they had any effect on the weekly sales of a particular supermarket product. Each of the combinations of price level and display level were put in place for a randomly selected week and the weekly sales of the product was recorded. Each combination was used three times over the course of the experiment. The results of the study are shown here: The ANOVA table is shown below: 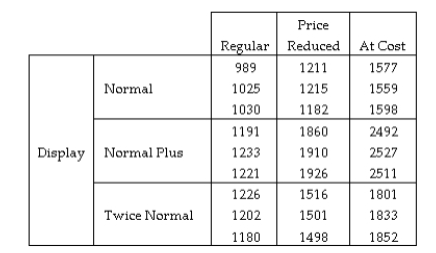 Source DF SS MS F Display 2 1691393 845696 Price 2 3089054 1544527 Display'Price 4 510705 127676 Error 18 8905 495 Total 26 5300057
Find the test statistic for determining whether the interaction between Price and Display is significant.
Source DF SS MS F Display 2 1691393 845696 Price 2 3089054 1544527 Display'Price 4 510705 127676 Error 18 8905 495 Total 26 5300057
Find the test statistic for determining whether the interaction between Price and Display is significant.
(Multiple Choice)
4.9/5 (32)
A multiple-comparison procedure for comparing four treatment means produced the confidence intervals shown below. Rank the means from smallest to largest. Use solid lines to connect those means which are not significantly different. - :(8,20) - :(-8,4) - :(10,20) - :(-20,-12) - :(-2,4) - :(10,24)
A)
B)
C)
D)
(Short Answer)
4.7/5 (43)
A counselor obtains SAT averages for incoming freshmen each year for a period covering 19 years, with the objective of determining the relationship between the SAT score and the year the test was given. The averages are then subjected to analysis for the purpose of drawing a conclusion regarding a trend. Determine whether the study is observational or designed.
(Multiple Choice)
4.8/5 (30)
A certain HMO is attempting to show the benefits of managed care to an insurance company. The HMO believes that certain types of doctors are more cost-effective than others. One theory is that certification level is an important factor in measuring the cost-effectiveness of physicians. To investigate this, the HMO obtained independent random samples of 20 physicians from each of the three certification levels- Board certified (C); Uncertified, board eligible (E); and Uncertified, board ineligible (I)-and recorded the total per member per month charges for each (a total of 60 physicians). In order to compare the mean charges for the three groups, the data were subjected to an analysis of variance. The results of the ANOVA are summarized in the following table. Take ? = 0.01 Source df SS MS F Value Prob > F Treatments 2 6032.43 3016.215 20.73 .0001 Error 57 8293.5 145.5 Total 59 14,325.93 Interpret the p-value of the ANOVA F-test.
(Multiple Choice)
4.7/5 (31)
A certain HMO is attempting to show the benefits of managed care to an insurance company. The HMO believes that certain types of doctors are more cost-effective than others. One theory is that certification level is an important factor in measuring the cost-effectiveness of physicians. To investigate this, the HMO obtained independent random samples of 29 physicians from each of the three certification levels-Board certified (C); Uncertified, board eligible (E); and Uncertified, board ineligible (I)-and recorded the total per-member, per-month charges for each (a total of 87 physicians). In order to compare the mean charges for the three groups, the data will be subjected to an analysis of variance. Give the degrees of freedom appropriate for conducting the ANOVA F-test.
(Multiple Choice)
4.9/5 (31)
Filters
- Essay(0)
- Multiple Choice(0)
- Short Answer(0)
- True False(0)
- Matching(0)