Exam 2: Methods for Describing Sets of Data
Exam 1: Statistics, Data, and Statistical Thinking73 Questions
Exam 2: Methods for Describing Sets of Data194 Questions
Exam 3: Probability283 Questions
Exam 4: Discrete Random Variables133 Questions
Exam 5: Continuous Random Variables139 Questions
Exam 6: Sampling Distributions47 Questions
Exam 7: Inferences Based on a Single Sample: Estimation With Confidence Intervals124 Questions
Exam 8: Inferences Based on a Single Sample: Tests of Hypothesis140 Questions
Exam 9: Inferences Based on a Two Samples: Confidence Intervals and Tests of Hypotheses94 Questions
Exam 10: Analysis of Variance: Comparing More Than Two Means90 Questions
Exam 11: Simple Linear Regression111 Questions
Exam 12: Multiple Regression and Model Building131 Questions
Exam 13: Categorical Data Analysis60 Questions
Exam 14: Nonparametric Statistics90 Questions
Select questions type
Percentile rankings are of practical value only with large data sets.
Free
(True/False)
4.8/5  (35)
(35)
Correct Answer: Verified
True
Which is expressed in the same units as the original data, the variance or the standard deviation?
Free
(Short Answer)
4.7/5 (39)
Correct Answer:Verified
standard deviation
The bars in a histogram should be arranged by height in descending order from left to right.
Free
(True/False)
4.8/5 (28)
Correct Answer:Verified
False
A small computing center has found that the number of jobs submitted per day to its computers has a distribution that is approximately mound-shaped and symmetric, with a mean of 86 jobs and a standard deviation of 5. On what percentage of days do the number of jobs submitted exceed 91?
(Essay)
4.7/5 (36)
What number is missing from the table? Grades on Test Frequency Relative Frequency A 6 .24 B 7 C 9 .36 D 2 .08 F 1 .04
(Multiple Choice)
4.9/5 (36)
The calculator screens summarize a data set. 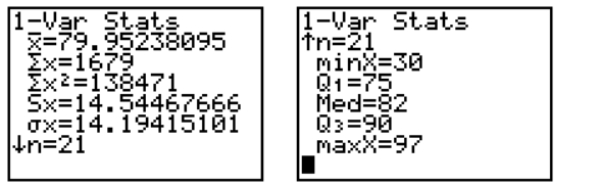 a. How many data items are in the set? b. What is the sum of the data? c. Identify the mean, median, and mode, if possible.
(Essay)
4.7/5 (26)
By law, a box of cereal labeled as containing 36 ounces must contain at least 36 ounces of cereal. The machine filling the boxes produces a distribution of fill weights that is mound-shaped and symmetric, with a mean equal to the setting on the machine and with a standard deviation equal to 0.04 ounce. To ensure that most of the boxes contain at least 36 ounces, the machine is set so that the mean fill per box is 36.12 ounces. What percentage of the boxes do, in fact, contain at least 36 ounces?
(Essay)
5.0/5 (37)
Use a graphing calculator or software to construct a box plot for the following data set. 12 18 14 17 19 16 14 18 15 17 11 13 14 11 16 18 15 13 17 15 14 19 12 16 17 2.9 Graphing Bivariate Relationships (Optional)
(Essay)
4.9/5 (32)
The temperature fluctuated between a low of 73°F and a high of 89°F. Which of the following could be calculated using just this information?
(Multiple Choice)
4.9/5 (29)
The ages of five randomly chosen professors are 69, 52, 55, 62, and 49. Calculate the sample variance of these ages.
(Essay)
4.7/5 (33)
Each year advertisers spend billions of dollars purchasing commercial time on network television. In the first 6 months of one year, advertisers spent $1.1 billion. Who were the largest spenders? In a recent article, the top 10 leading spenders and how much each spent (in million of dollars) were listed: Company A \ 70.4 Company F \ 24.6 Company B 61.7 Company G 24.3 Company C 57.2 Company H 23.1 Company D 54.5 Company I 21.8 Company E 31.4 Company J 19.9 Calculate the mean and median for the data.
(Essay)
4.8/5 (38)
The data show the total number of medals (gold, silver, and bronze) won by each country winning at least one gold medal in the Winter Olympics. 1 2 3 3 4 9 9 11 11 11 14 14 19 22 23 24 25 29
a. Complete the class frequency table for the data.
Total Medals Frequency 1-5 6-10 11-15 16-20 21-25 26-30
b. Using the classes from the frequency table, construct a histogram for the data.
(Essay)
4.7/5 (27)
Scatterplots are useful for both qualitative and quantitative data.
(True/False)
4.9/5 (36)
A radio station claims that the amount of advertising each hour has a mean of 16 minutes and a standard deviation of 2.7 minutes. You listen to the radio station for 1 hour and observe that the amount of advertising time is 8 minutes. Calculate the z-score for this amount of advertising time.
(Multiple Choice)
4.9/5 (40)
Parking at a university has become a problem. University administrators are interested in determining the average time it takes a student to find a parking spot. An administrator inconspicuously followed 300 students and recorded how long it took each of them to find a parking spot. Which of the following types of graphs should not be used to display information concerning the students parking times?
(Multiple Choice)
4.8/5 (35)
A frequency table displays the proportion of observations falling into each class.
(True/False)
4.9/5 (35)
The bars in a bar graph can be arranged by height in ascending order from left to right.
(True/False)
4.7/5 (29)
What number is missing from the table? Year in College Frequency Relative Frequency Freshman 600 .30 Sophomore 560 .28 Junior .22 Senior 400 .20
(Multiple Choice)
4.9/5 (27)
Filters
- Essay(0)
- Multiple Choice(0)
- Short Answer(0)
- True False(0)
- Matching(0)