Exam 11: Simple Linear Regression
Exam 1: Statistics, Data, and Statistical Thinking73 Questions
Exam 2: Methods for Describing Sets of Data194 Questions
Exam 3: Probability283 Questions
Exam 4: Discrete Random Variables133 Questions
Exam 5: Continuous Random Variables139 Questions
Exam 6: Sampling Distributions47 Questions
Exam 7: Inferences Based on a Single Sample: Estimation With Confidence Intervals124 Questions
Exam 8: Inferences Based on a Single Sample: Tests of Hypothesis140 Questions
Exam 9: Inferences Based on a Two Samples: Confidence Intervals and Tests of Hypotheses94 Questions
Exam 10: Analysis of Variance: Comparing More Than Two Means90 Questions
Exam 11: Simple Linear Regression111 Questions
Exam 12: Multiple Regression and Model Building131 Questions
Exam 13: Categorical Data Analysis60 Questions
Exam 14: Nonparametric Statistics90 Questions
Select questions type
The Method of Least Squares specifies that the regression line has an average error of 0 and has an SSE that is minimized.
Free
(True/False)
4.9/5  (41)
(41)
Correct Answer: Verified
True
A county real estate appraiser wants to develop a statistical model to predict the appraised value of houses in a section of the county called East Meadow. One of the many variables thought to be an important predictor of appraised value is the number of rooms in the house. Consequently, the appraiser decided to fit the simple linear regression model:
where appraised value of the house (in thousands of dollars) and number of rooms.
What set of hypotheses would you test to determine whether appraised value is positively linearly related to number of rooms?
A) vs.
B) vs.
c) vs.
D) vs.
Free
(Short Answer)
4.8/5 (38)
Correct Answer:Verified
A
A study of the top 75 MBA programs attempted to predict the average starting salary (in $1000's) of graduates of the program based on the amount of tuition (in $1000's) charged by the program. The results of a simple linear regression analysis are shown below: Least Squares Linear Regression of Salary Predictor
Variables Coefficient Std Error T P Constant 18.1849 10.3336 1.76 0.0826 Size 1.47494 0.14017 10.52 0.0000
R-Squared Resid. Mean Square (MSE)
Adjusted R-Squared Standard Deviation The model was then used to create 95% confidence and prediction intervals for y and for E(Y) when the tuition charged by the MBA program was $75,000. The results are shown here: 95% confidence interval for E(Y): ($123,390, $134,220) 95% prediction interval for Y: ($82,476, $175,130) Which of the following interpretations is correct if you want to use the model to estimate E(Y) for all MBA programs?
Free
(Multiple Choice)
4.9/5 (45)
Correct Answer:Verified
C
Consider the data set shown below. Find the 95% confidence interval for the slope of the regression line. 0 3 2 3 8 10 11 -2 0 2 4 6 8 10
A)
B)
C)
D)
(Short Answer)
4.9/5 (23)
Consider the following model , where is the daily rate of return of a stock, and is the daily rate of return of the stock market as a whole, measured by the daily rate of return of Standard \& Poor's (S\&P) 500 Composite Index. Using a random sample of days from 2007, the least squares lines shown in the table below were obtained for four firms. The estimated standard error of is shown to the right of each least squares prediction equation.
Firm Estimated Market Model Estimated Standard Error of \beta1 Company A y=.0010+1.40x .03 Company B y=.0005-1.21x .06 Company C y=.0010+1.62x 1.34 Company D y=.0013+.76x .15
Calculate the test statistic for determining whether the market model is useful for predicting daily rate of return of Company A's stock.
A)
B)
C)
D)
(Short Answer)
4.7/5 (34)
Consider the data set shown below. Find the standard deviation of the least squares regression line. 0 3 2 3 8 10 11 -2 0 2 4 6 8 10
(Multiple Choice)
5.0/5 (33)
A company keeps extensive records on its new salespeople on the premise that sales should increase with experience. A random sample of seven new salespeople produced the data on experience and sales shown in the table. Months on Job Monthly Sales y (\ thousands) 2 2.4 4 7.0 8 11.3 12 15.0 1 .8 5 3.7 9 12.0
Summary statistics yield , and State the assumptions necessary for predicting the monthly sales based on the linear relationship with the months on the job.
(Essay)
4.8/5 (35)
Is the number of games won by a major league baseball team in a season related to the team's batting average? Data from 14 teams were collected and the summary statistics yield:
Find the least squares prediction equation for predicting the number of games won, y, using a straight-line relationship with the team's batting average, x.
(Essay)
4.9/5 (26)
A 95% prediction interval for SALARY when GMAT = 600 is ($37,915, $51,948). Interpret this interval for the situation above.
(Multiple Choice)
4.8/5 (45)
The data for points were subjected to a simple linear regression with the results: and .
a. Test whether the two variables, and , are positively linearly related. Use .
b. Construct and interpret a confidence interval for .
(Essay)
4.9/5 (29)
Consider the following pairs of observations: x 2 0 3 3 5 y 1 3 4 6 7 a. Construct a scattergram for the data. b. Find the least squares line, and plot it on your scattergram. c. Find a 99% confidence interval for the mean value of y when x = 1. d. Find a 99% prediction interval for a new value of y when x = 1.
(Essay)
4.9/5 (42)
The probabilistic model allows the E(y) values to fall around the regression line while the actual values of y must fall on the line.
(True/False)
4.9/5 (39)
In a study of feeding behavior, zoologists recorded the number of grunts of a warthog feeding by a lake in the 15 minute period following the addition of food. The data showing the number of grunts and the age of the warthog (in days) are listed below: Number of Grunts Age (days) 115 143 93 159 64 173 69 178 88 185 65 192 87 201 42 207 47 213
a. Find SSE, , and .
b. Interpret the value of .
(Essay)
4.7/5 (33)
The coefficient of correlation is a useful measure of the linear relationship between two variables.
(True/False)
4.8/5 (28)
What is the relationship between diamond price and carat size? 307 diamonds were sampled and a straight-line relationship was hypothesized between y = diamond price (in dollars) and x = size of the diamond (in carats). The simple linear regression for the analysis is shown below: Least Squares Linear Regression of PRICE 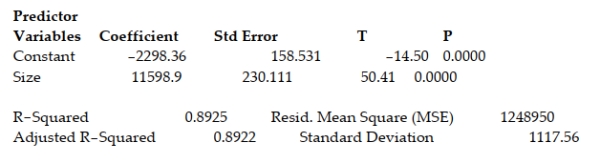 Which of the following conclusions is correct when testing to determine if the size of the diamond is a useful positive linear predictor of the price of a diamond?
(Multiple Choice)
4.9/5 (33)
What is the relationship between diamond price and carat size? 307 diamonds were sampled and a straight-line relationship was hypothesized between y = diamond price (in dollars) and x = size of the diamond (in carats). The simple linear regression for the analysis is shown below: Least Squares Linear Regression of PRICE 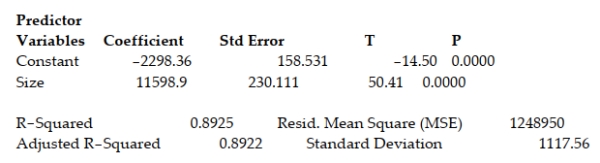 Which of the following assumptions is not stated correctly?
(Multiple Choice)
4.8/5 (36)
The dean of the Business School at a small Florida college wishes to determine whether the grade -point average (GPA) of a graduating student can be used to predict the graduate's starting salary. More specifically, the dean wants to know whether higher GPAs lead to higher starting salaries. Records for 23 of last year's Business School graduates are selected at random, and data on GPA (x) and starting salary (y, in $thousands) for each graduate were used to fit the model . The value of the test statistic for testing ?1 is 17.169. Select the proper conclusion.
(Multiple Choice)
4.8/5 (29)
A company keeps extensive records on its new salespeople on the premise that sales should increase with experience. A random sample of seven new salespeople produced the data on experience and sales shown in the table. Months on Job Monthly Sales (\ thousands) 2 2.4 4 7.0 8 11.3 12 15.0 1 .8 5 3.7 9 12.0
Stumary statistics yield , and . Using , find and interpret the coefficient of determination.
(Essay)
4.8/5 (41)
Filters
- Essay(0)
- Multiple Choice(0)
- Short Answer(0)
- True False(0)
- Matching(0)