Exam 13: Simple Linear Regression
Exam 1: Defining and Collecting Data200 Questions
Exam 2: Organizing and Visualizing189 Questions
Exam 3: Numerical Descriptive Measures80 Questions
Exam 4: Basic Probability108 Questions
Exam 5: Discrete Probability Distributions81 Questions
Exam 6: Conthe Tinuonormausl Disdis Tributionstribution and Other38 Questions
Exam 7: Sampling Distributions62 Questions
Exam 8: Confidence Interval Estimation139 Questions
Exam 9: Fundamentals of Hypothesis Testing: One-Sample Tests133 Questions
Exam 10: Two-Sample Tests95 Questions
Exam 11: Analysis of Variance73 Questions
Exam 12: Chi-Square and Nonparametric100 Questions
Exam 13: Simple Linear Regression89 Questions
Exam 14: Introduction to Multiple113 Questions
Exam 15: Multiple Regression62 Questions
Exam 16: Time-Series Forecasting61 Questions
Exam 17: Business Analytics102 Questions
Exam 18: A Roadmap for Analyzing Data133 Questions
Exam 19: Statistical Applications in Quality Management86 Questions
Exam 20: Decision Making121 Questions
Select questions type
True of False: The Chancellor of a university has commissioned a team to collect data on
students' GPAs and the amount of time they spend bar hopping every week (measured in
minutes).He wants to know if imposing much tougher regulations on all campus bars to make it
more difficult for students to spend time in any campus bar will have a significant impact on
general students' GPAs.His team should use a t test on the slope of the population regression.
(True/False)
4.8/5  (29)
(29)
SCENARIO 13-2 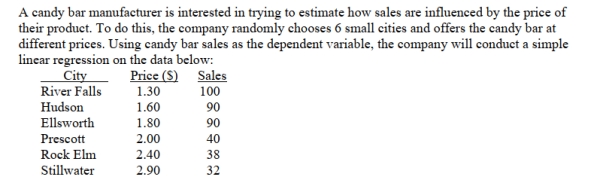 -Referring to Scenario 13-2, what is the coefficient of correlation for these data?
(Multiple Choice)
4.8/5 (32)
The residual represents the discrepancy between the observed dependent variable and its
_______ value.
(Essay)
4.8/5 (25)
True or False: The Regression Sum of Squares (SSR)can never be greater than the Total Sum of
Squares (SST).
(True/False)
4.7/5 (32)
If you wanted to find out if alcohol consumption (measured in fluid oz.)and grade point
Average on a 4-point scale are linearly related, you would perform a 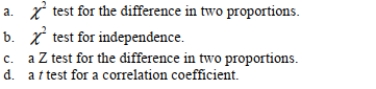
(Multiple Choice)
4.8/5 (35)
SCENARIO 13-11
A computer software developer would like to use the number of downloads (in thousands)for the trial
version of his new shareware to predict the amount of revenue (in thousands of dollars)he can make
on the full version of the new shareware.Following is the output from a simple linear regression
along with the residual plot and normal probability plot obtained from a data set of 30 different
sharewares that he has developed: 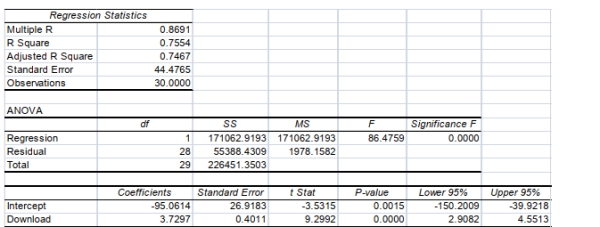
 Simple Linear Regression 13-43
 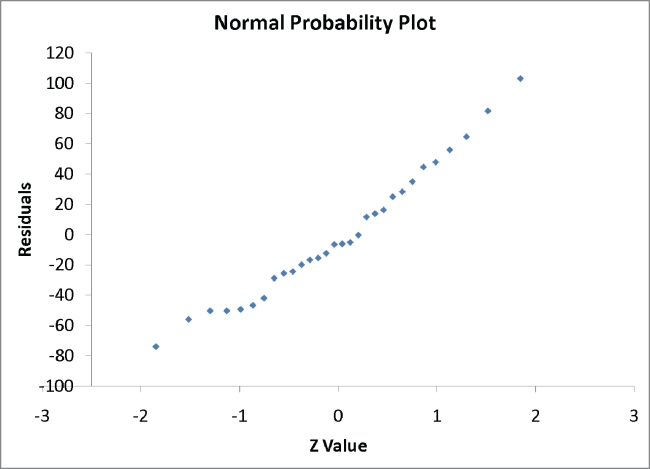 -Referring to Scenario 13-11, which of the following is the correct interpretation for the
Coefficient of determination?
-Referring to Scenario 13-11, which of the following is the correct interpretation for the
Coefficient of determination?
(Multiple Choice)
4.8/5 (29)
SCENARIO 13-1 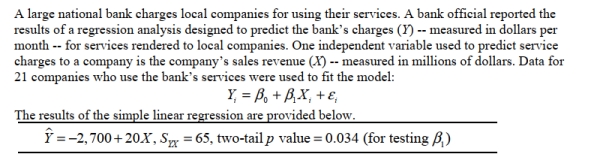 -Referring to Scenario 13-1, interpret the estimate of
  , the standard deviation of the random
Error term (standard error of the estimate)in the model.
, the standard deviation of the random
Error term (standard error of the estimate)in the model.
(Multiple Choice)
4.8/5 (40)
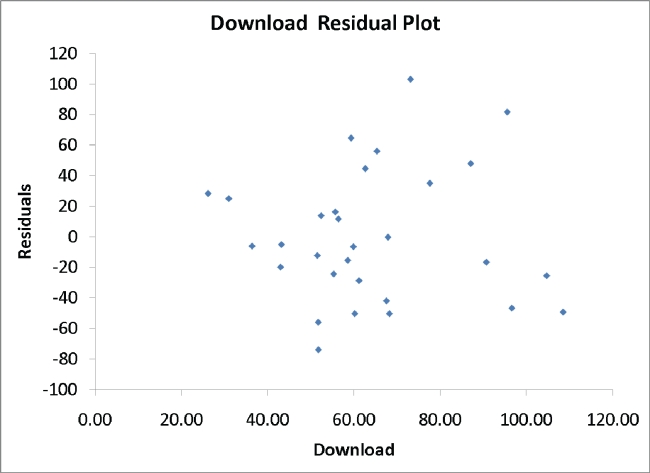
SCENARIO 13-11
A computer software developer would like to use the number of downloads (in thousands)for the trial
version of his new shareware to predict the amount of revenue (in thousands of dollars)he can make
on the full version of the new shareware.Following is the output from a simple linear regression
along with the residual plot and normal probability plot obtained from a data set of 30 different
sharewares that he has developed:
Simple Linear Regression 13-43
-Referring to Scenario 13-11, which of the following assumptions appears to have been
Violated?
(Multiple Choice)
4.9/5 (29)
SCENARIO 13-11
A computer software developer would like to use the number of downloads (in thousands)for the trial
version of his new shareware to predict the amount of revenue (in thousands of dollars)he can make
on the full version of the new shareware.Following is the output from a simple linear regression
along with the residual plot and normal probability plot obtained from a data set of 30 different
sharewares that he has developed:
Simple Linear Regression 13-43
-True or False: Referring to Scenario 13-11, there appears to be autocorrelation in the residuals.
(True/False)
4.9/5 (44)
SCENARIO 13-2
-Referring to Scenario 13-2, what percentage of the total variation in candy bar sales is explained
By prices?
(Multiple Choice)
4.9/5 (35)
SCENARIO 13-11
A computer software developer would like to use the number of downloads (in thousands)for the trial
version of his new shareware to predict the amount of revenue (in thousands of dollars)he can make
on the full version of the new shareware.Following is the output from a simple linear regression
along with the residual plot and normal probability plot obtained from a data set of 30 different
sharewares that he has developed:
Simple Linear Regression 13-43
-True or False: Referring to Scenario 13-11, the Durbin-Watson statistic is inappropriate for this
data set.
(True/False)
4.9/5 (35)
SCENARIO 13-4 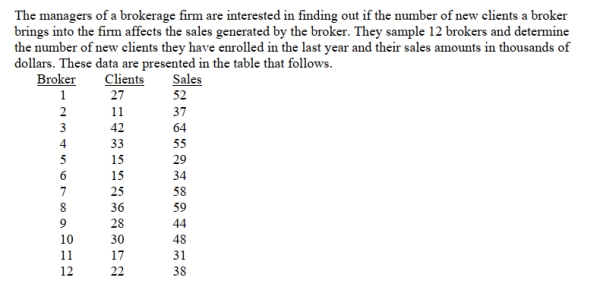 Simple Linear Regression 13-13
-Referring to Scenario 13-4, the managers of the brokerage firm wanted to test the hypothesis that
the population slope was equal to 0.At a level of significance of 0.01, the decision that should be
made implies that _____ (there is a or there is no)linear dependent relationship between the
independent and dependent variables.
Simple Linear Regression 13-13
-Referring to Scenario 13-4, the managers of the brokerage firm wanted to test the hypothesis that
the population slope was equal to 0.At a level of significance of 0.01, the decision that should be
made implies that _____ (there is a or there is no)linear dependent relationship between the
independent and dependent variables.
(Essay)
4.7/5 (36)
SCENARIO 13-11
A computer software developer would like to use the number of downloads (in thousands)for the trial
version of his new shareware to predict the amount of revenue (in thousands of dollars)he can make
on the full version of the new shareware.Following is the output from a simple linear regression
along with the residual plot and normal probability plot obtained from a data set of 30 different
sharewares that he has developed:
Simple Linear Regression 13-43
-Referring to Scenario 13-11, what is the standard deviation around the regression line?
(Essay)
4.9/5 (30)
If the residuals in a regression analysis of time-ordered data are not correlated, the value of the
Durbin-Watson D statistic should be near __________.
(Essay)
4.9/5 (31)
SCENARIO 13-11
A computer software developer would like to use the number of downloads (in thousands)for the trial
version of his new shareware to predict the amount of revenue (in thousands of dollars)he can make
on the full version of the new shareware.Following is the output from a simple linear regression
along with the residual plot and normal probability plot obtained from a data set of 30 different
sharewares that he has developed:
Simple Linear Regression 13-43
-Referring to Scenario 13-11, which of the following is the correct alternative hypothesis for
Testing whether there is a linear relationship between revenue and the number of downloads? 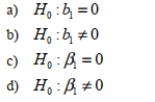
(Multiple Choice)
4.7/5 (34)
Filters
- Essay(0)
- Multiple Choice(0)
- Short Answer(0)
- True False(0)
- Matching(0)