Exam 10: Two-Sample Tests
Exam 1: Defining and Collecting Data200 Questions
Exam 2: Organizing and Visualizing189 Questions
Exam 3: Numerical Descriptive Measures80 Questions
Exam 4: Basic Probability108 Questions
Exam 5: Discrete Probability Distributions81 Questions
Exam 6: Conthe Tinuonormausl Disdis Tributionstribution and Other38 Questions
Exam 7: Sampling Distributions62 Questions
Exam 8: Confidence Interval Estimation139 Questions
Exam 9: Fundamentals of Hypothesis Testing: One-Sample Tests133 Questions
Exam 10: Two-Sample Tests95 Questions
Exam 11: Analysis of Variance73 Questions
Exam 12: Chi-Square and Nonparametric100 Questions
Exam 13: Simple Linear Regression89 Questions
Exam 14: Introduction to Multiple113 Questions
Exam 15: Multiple Regression62 Questions
Exam 16: Time-Series Forecasting61 Questions
Exam 17: Business Analytics102 Questions
Exam 18: A Roadmap for Analyzing Data133 Questions
Exam 19: Statistical Applications in Quality Management86 Questions
Exam 20: Decision Making121 Questions
Select questions type
If you wish to determine whether there is evidence that the proportion of items of interest is
Higher in group 1 than in group 2, the appropriate test to use is
(Multiple Choice)
4.8/5  (39)
(39)
In testing for the differences between the means of 2 independent populations where the variances
In each population are unknown but assumed equal, the degrees of freedom are 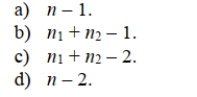
(Multiple Choice)
4.9/5 (40)
SCENARIO 10-8
A few years ago, Pepsi invited consumers to take the "Pepsi Challenge." Consumers were asked to
decide which of two sodas, Coke or Pepsi, they preferred in a blind taste test.Pepsi was interested in
determining what factors played a role in people's taste preferences.One of the factors studied was
the gender of the consumer.Below are the results of analyses comparing the taste preferences of men
and women with the proportions depicting preference for Pepsi. 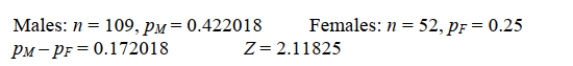 -Referring to Scenario 10-8, suppose Pepsi wanted to test to determine if the males preferred
Pepsi more than the females.Using the test statistic given, compute the appropriate p-value for
The test.
-Referring to Scenario 10-8, suppose Pepsi wanted to test to determine if the males preferred
Pepsi more than the females.Using the test statistic given, compute the appropriate p-value for
The test.
(Multiple Choice)
4.9/5 (36)
True or False: Repeated measurements from the same individuals is an example of data collected
from two related populations.
(True/False)
4.9/5 (38)
SCENARIO 10-6
To investigate the efficacy of a diet, a random sample of 16 male patients is selected from a
population of adult males using the diet.The weight of each individual in the sample is taken at the
start of the diet and at a medical follow-up 4 weeks later.Assuming that the population of differences
in weight before versus after the diet follow a normal distribution, the t-test for related samples can be
used to determine if there was a significant decrease in the mean weight during this period.Suppose
the mean decrease in weights over all 16 subjects in the study is 3.0 pounds with the standard
deviation of differences computed as 6.0 pounds.
-Referring to Scenario 10-6, what is the 99% confidence interval estimate for the mean difference
in weight before and after the diet?
(Essay)
4.9/5 (38)
True or False: The sample size in each independent sample must be the same if we are to test for
differences between the means of two independent populations.
(True/False)
4.9/5 (44)
The Wall Street Journal recently ran an article indicating differences in perception of sexual
Harassment on the job between men and women.The article claimed that women perceived the
Problem to be much more prevalent than did men.One question asked to both men and women
Was: "Do you think sexual harassment is a major problem in the American workplace?" Some
24% of the men compared to 62% of the women responded "Yes." Suppose that 150 women and
200 men were interviewed.What is the value of the test statistic?
(Multiple Choice)
4.7/5 (43)
SCENARIO 10-5 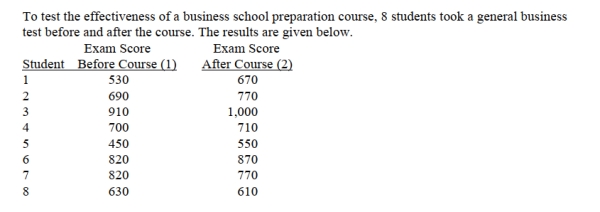 10-16 Two-Sample Tests
-Referring to Scenario 10-5, the number of degrees of freedom is
10-16 Two-Sample Tests
-Referring to Scenario 10-5, the number of degrees of freedom is
(Multiple Choice)
4.8/5 (30)
SCENARIO 10-5
10-16 Two-Sample Tests
-Referring to Scenario 10-5, the value of the sample mean difference is _______ if the difference
Scores reflect the results of the exam after the course minus the results of the exam before the
Course.
(Multiple Choice)
4.9/5 (33)
True or False: A statistics professor wanted to test whether the grades on a statistics test were the
same for upper and lower classmen.The professor took a random sample of size 10 from each,
conducted a test and found out that the variances were equal.For this situation, the professor
should use a t test with related samples.
(True/False)
4.7/5 (41)
A powerful women's group has claimed that men and women differ in attitudes about sexual
Discrimination.A group of 50 men (group 1)and 40 women (group 2)were asked if they thought
Sexual discrimination is a problem in the United States.Of those sampled, 11 of the men and 19
Of the women did believe that sexual discrimination is a problem.Assuming W designates
Women's responses and M designates men's, which of the following are the appropriate null and
Alternative hypotheses to test the group's claim? 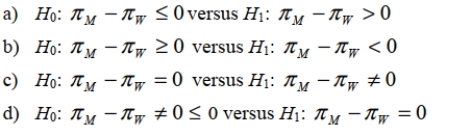
(Multiple Choice)
4.8/5 (34)
SCENARIO 10-4
Two samples each of size 25 are taken from independent populations assumed to be normally
distributed with equal variances.The first sample has a mean of 35.5 and standard deviation of 3.0
while the second sample has a mean of 33.0 and standard deviation of 4.0.
-
(Essay)
4.9/5 (35)
Filters
- Essay(0)
- Multiple Choice(0)
- Short Answer(0)
- True False(0)
- Matching(0)